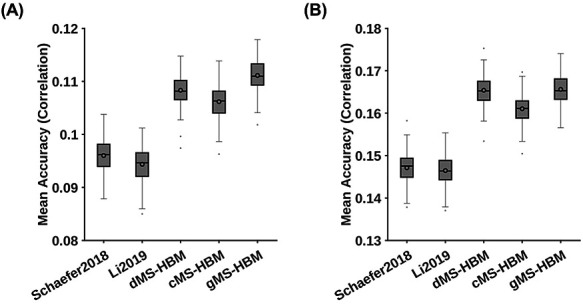
Figure 9 .

MS-HBM achieves the best behavioral prediction performance as measured by Pearson’s correlation. (A) Average prediction accuracies (Pearson’s correlation) of all 58 behavioral measures. Boxplots utilized default Matlab parameters, that is, box shows median and interquartile range (IQR). Whiskers indicate 1.5 IQR (not SD). Circle indicates mean. dMS-HBM, cMS-HBM, and gMS-HBM achieved average prediction accuracies of r = 0.1083 ± 0.0031 (mean ± SD), 0.1062 ± 0.0031, and 0.1111 ± 0.0031, respectively. On the other hand, Schaefer2018 and Li2019 achieved average prediction accuracies of r = 0.0960 ± 0.0031 and 0.0944 ± 0.0031, respectively. (B) Average prediction accuracies (Pearson’s correlation) of 36 behavioral measures with accuracies (Pearson’s correlation) higher than 0.1 for at least one approach (“36 behaviors > 0.1”). dMS-HBM, cMS-HBM, and gMS-HBM achieved average prediction accuracies of r = 0.1630 ± 0.0034 (mean ± SD), 0.1590 ± 0.0035, and 0.1656 ± 0.0036, respectively. On the other hand, Schaefer2018 and Li2019 achieved average prediction accuracies of r = 0.1442 ± 0.0036 and 0.1444 ± 0.0035, respectively.
