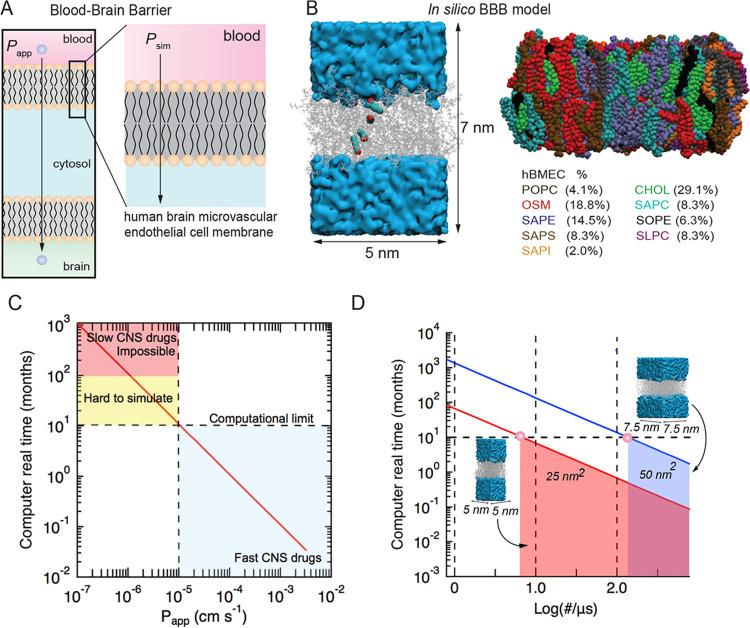
Figure 1.
Developing an in silico model of solute transport across a lipid bilayer model of the blood–brain barrier and benchmarking simulations. (A) Schematic illustration of the luminal and abluminal membranes of a brain microvascular endothelial cell. Passive transport into the brain involves diffusion across both membranes. (B) Overlays from a simulation showing the location of a solute during translocation across the lipid bilayer. The lipid bilayer consists of nine lipids: POPC (dark gray), OSM (red), SAPE (purple), SAPS (brown), SAPI (orange), cholesterol (green), SAPC (cyan), SOPE (black), and SLPC (magenta). Atomic detail models were constructed using the CHARMM-GUI membrane builder. (C) Molecular dynamics simulations of BBB permeability showing the real computational time (in months) to simulate solute transport at 310 K using a modern graphics processing unit (GPU) based on a solution volume of 100 nm3 and a bilayer area of 25 nm2. We assume that 100 translocation events are necessary to determine the steady-state permeability, and that simulation of 100 ns takes 1 day. Experimental values of solute permeability range from about 10–6 cm s–1 (slowest) to 10–3 cm s–1 (fastest). (D) Relationship between bilayer dimensions and computational time, with smaller bilayer areas enabling longer simulation times.

