
Figure 8.
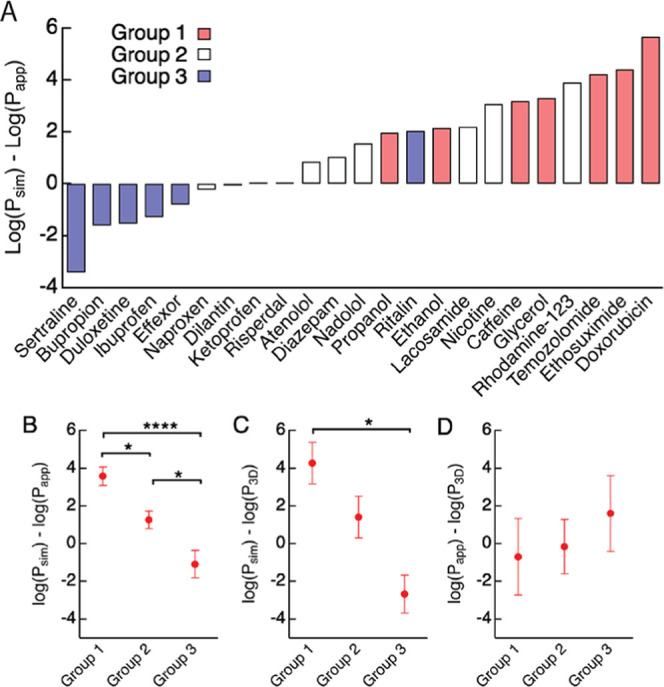
Difference between permeabilities obtained from simulations (Psim,310 K) and in vitro (Papp) and in vivo (P3D) values for the three groups. (A) Difference in permeability (log Psim,310 K – log Papp) for each solute at 310 K, color coded by group (red: group 1; white: group 2; blue: group 3). (B) Difference between simulations and in vitro permeabilities (log Psim,310 K – log Papp). (C) Difference between simulations and in vivo permeabilities (log Psim,310 K – log P3D). (D) Difference between in vitro and in vivo permeabilities (log Papp – log P3D). Bars represent mean ± SE.