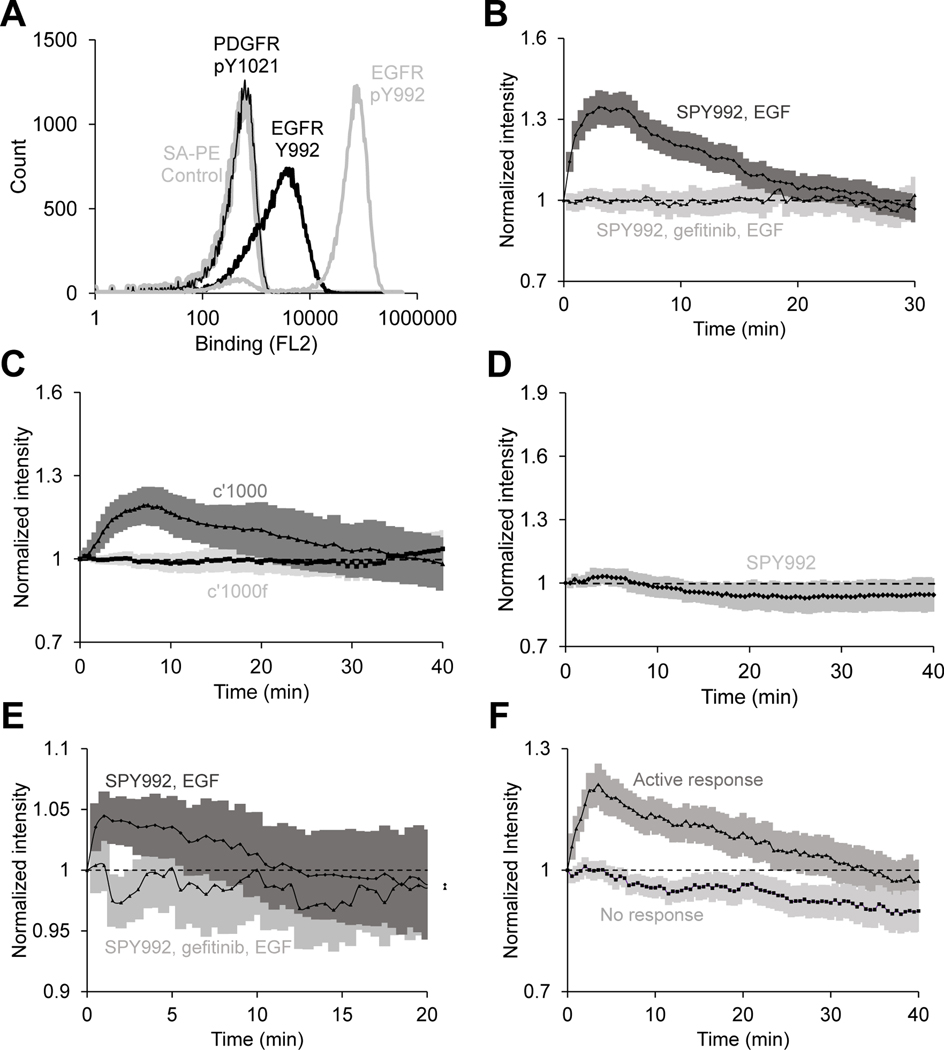
Fig 4. The SPY992 biosensor closely tracks the expected kinetics of EGFR phosphorylation and displays increased specificity for EGFR pTyr992 site of EGFR in live-cell imaging.
(A) Yeast cells displaying SPY992 on the cell surface were labeled with biotinylated synthetic peptides corresponding to the pTyr992 or Tyr992 sites in EGFR and the pTyr1021 site in PDGFR, followed by secondary labeling with SA-PE. A control sample of yeast cells labeled with only SA-PE is also shown. n = 3 independent experiments. (B) Normalized membrane recruitment of SPY992 in response to EGF stimulation of EGFR-expressing NR6 cells pretreated with gefitinib (n = 27 cells from 2 independent experiments) or not pretreated (n = 110 cells from 5 independent experiments), as measured by TIRF microscopy. p <0.0001 by two-way ANOVA. (C) Normalized membrane recruitment of SPY992 in response to EGF stimulation of NR6 cells expressing the c’1000 EGFR truncation mutant (n = 20 cells from 4 independent experiments) and NR6 cells expressing the c’1000F EGFR mutant with the Y992F mutation (n = 23 cells from 5 independent experiments). p <0.0001 by two-way ANOVA. (D) Normalized membrane recruitment of SPY992 in response to PDGF stimulation of NR6 parental cells (n = 21 cells from 4 independent experiments). (E) Normalized membrane recruitment of SPY992 in response to EGF stimulation of MDA-MB-231 cells pretreated with gefitinib for 5 min. (n = 97 cells from 4 independent experiments) or not pretreated (n = 52 cells from 6 independent experiments). p <0.0001 by two-way ANOVA. (F) Normalized membrane recruitment of SPY992 in EGFR-expressing NR6 cells in response to stimulation with a sub-threshold concentration of EGF (300 pM). Data from cells with an active response (n = 105 cells from 5 independent experiments) and no response (n = 95 cells from 5 independent experiments) are shown. p <0.0001 by two-way ANOVA. 95% confidence intervals are shaded (B–F).

