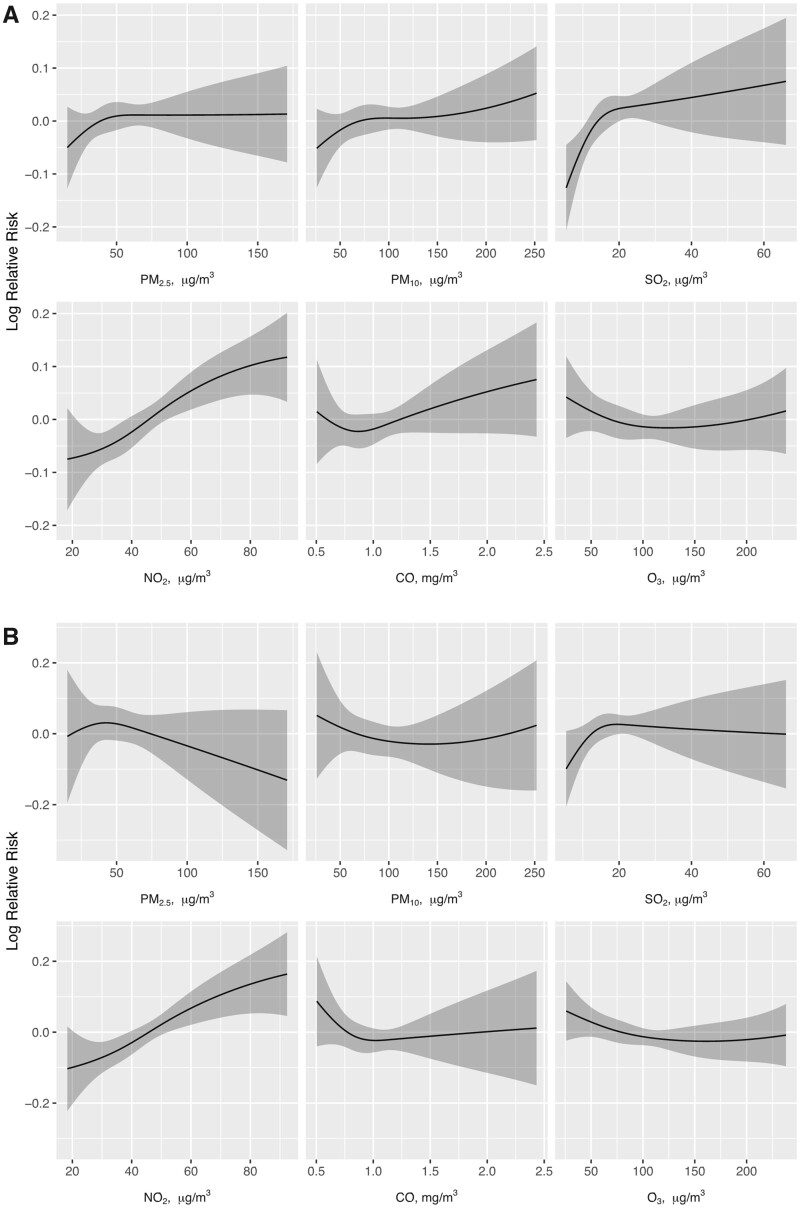
FIGURE 1:
The smooth curves of the ambient levels of air pollutants and the RR of HA-AKI. (A) The effect of the daily average of each air pollutant on the risk of HA-AKI was estimated from single-pollutant models. (B) The effect of the daily average of each air pollutant on the risk of HA-AKI was estimated from the six-pollutant model that included all six air pollutants in a single regression model. The 95% CIs of the estimates are given by the shaded areas.

