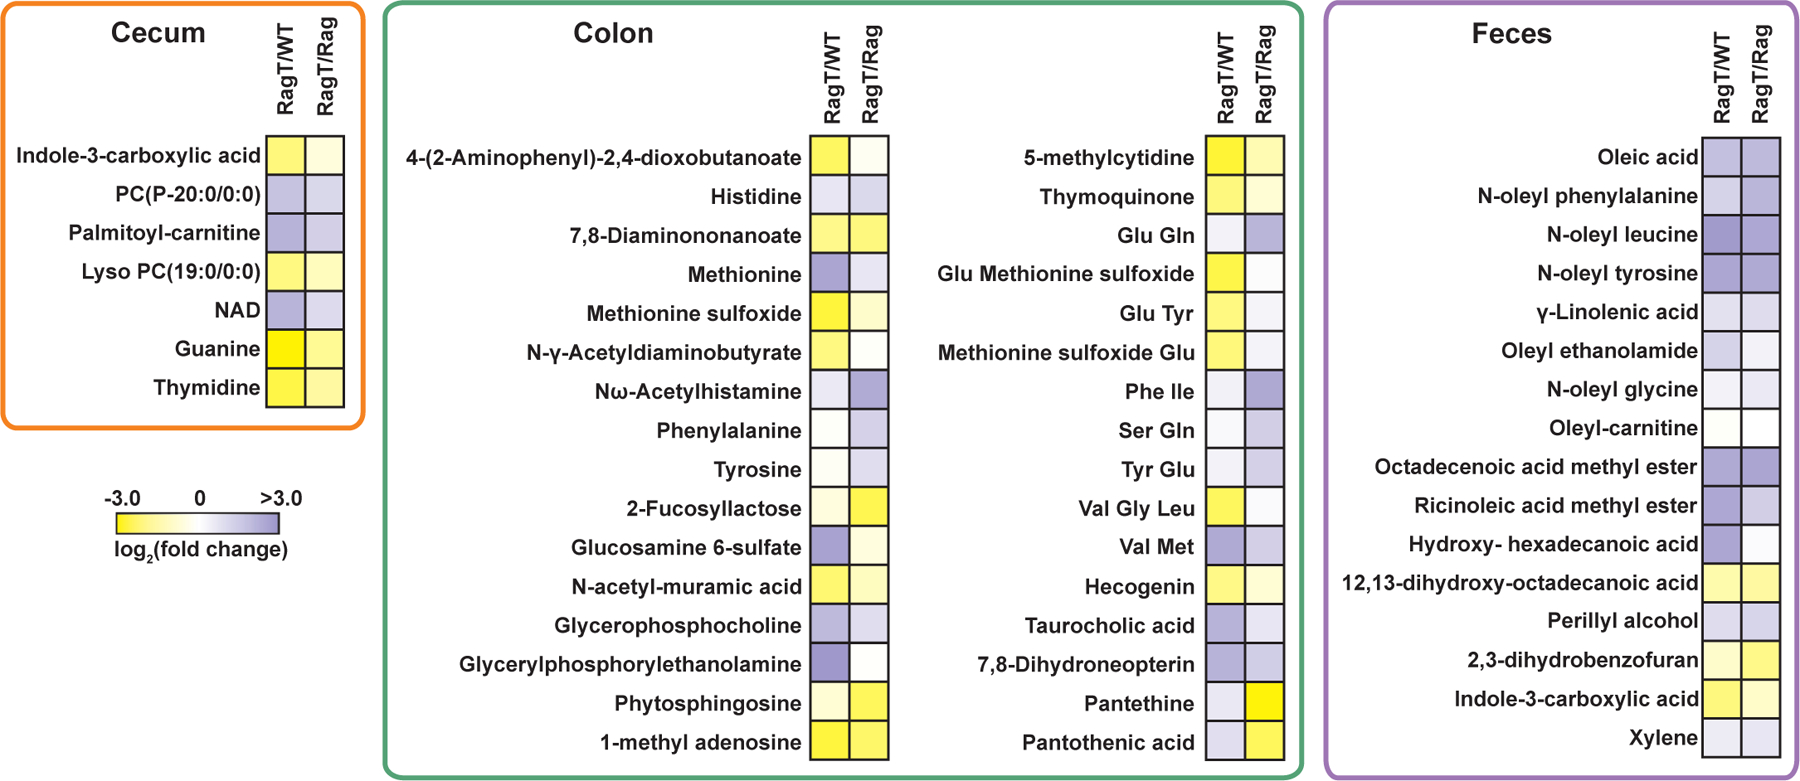
Fig. 3. IBD-altered metabolites in cecal, colonic, and fecal samples.

Heatmap of statistically significant (q-value <0.05, one-way ANOVA) metabolites represented as fold-change of RagT relative to WT and Rag using a logarithmic scale (log2). Yellow and purple shading indicate down- and up-regulation in the RagT cohort, respectively.
