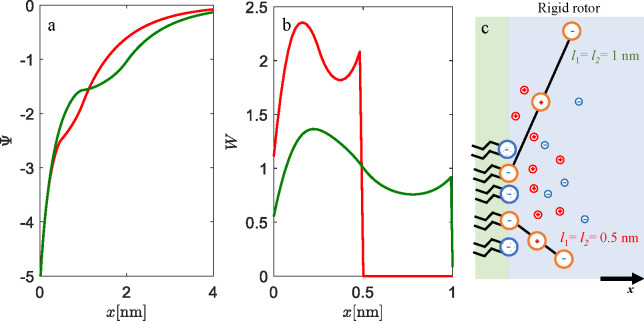
Figure 4.
Influence of the length of head groups on EDL properties: (a) electrostatic potential profiles Ψ, (b) probability densities of rigid rod-like head groups W, and (c) the schematic representation of the most probable conformation of the rigid rod-like head groups. The lengths of head group segments are l1 = l2 = 0.5 nm (red lines) and l1 = l2 = 1 nm (green lines). Calculations are made for c = 0.1 mol dm–3 1:1 electrolyte concentration, a = 0.6 nm2, and β = 0.5.

