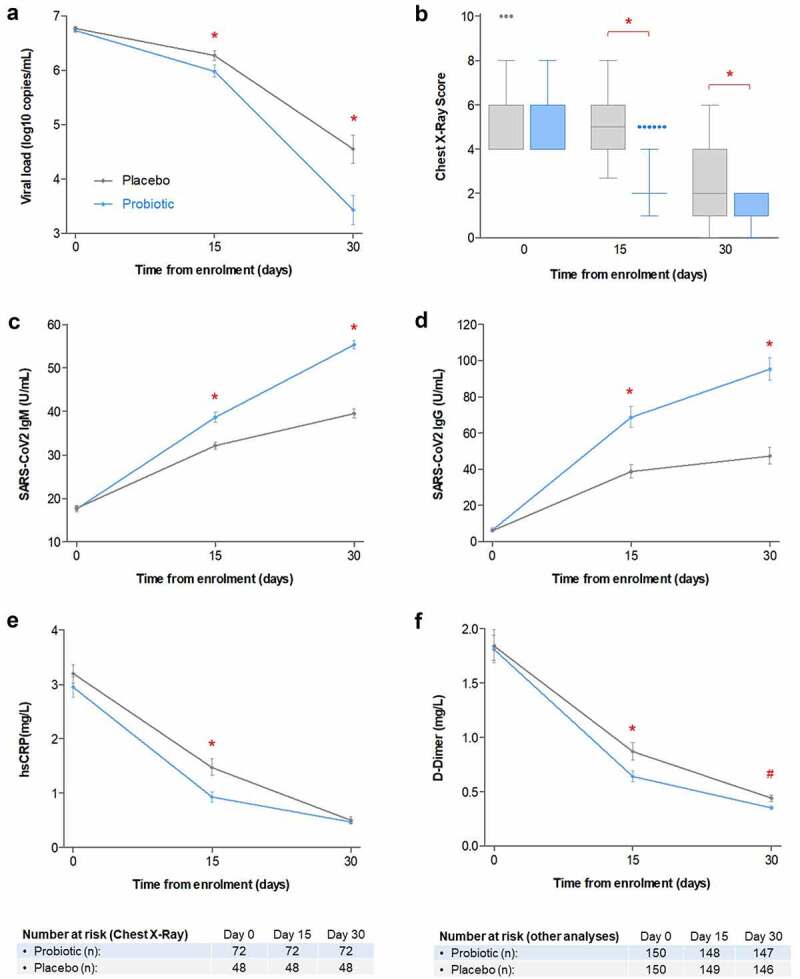
Figure 2.

(a) Mean viral load (as base 10 logarithm of viral copies/mL), as measured by SARS-CoV2-specific RT-qPCR. (b) Box plot (median, quartiles, Tukey whiskers and individual outliers) of chest X-ray lug abnormality score, in subjects displaying lung infiltrates at baseline (n = 116). (c) Geometric mean serum titers of SARS-CoV2 spike-binding IgM. (d) Geometric mean serum titers of SARS-CoV2 spike-binding IgG. (e) Geometric means of serum levels of high-sensitivity hs-CRP. (f) Geometric means of serum levels of D-Dimer. Error bars denote 95%CI of the means. Probiotic treatment group is depicted in blue, while placebo is depicted in gray. Main effects of group, visit and group by visit were significant in all analyses ((a) to (f), P < .001). (*) Group by visit significance at specific timepoint (P < .001); (#) Group by visit statistical trend at specific timepoint (P < .10).
