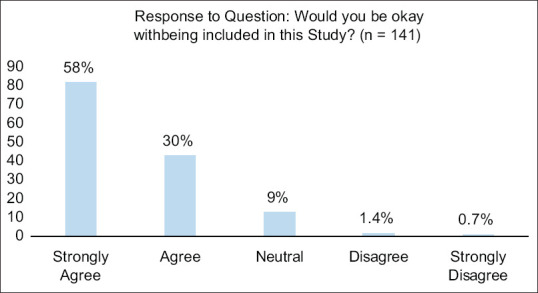
Figure 2.

Graph showing percentage of each response of the question: “Would you be okay with being included in this study?” – A question proposed on the survey for community consultation. There was a total of 141 responses to this question. Of those responses, 125 (88.7%) responded that they strongly agreed or agreed
