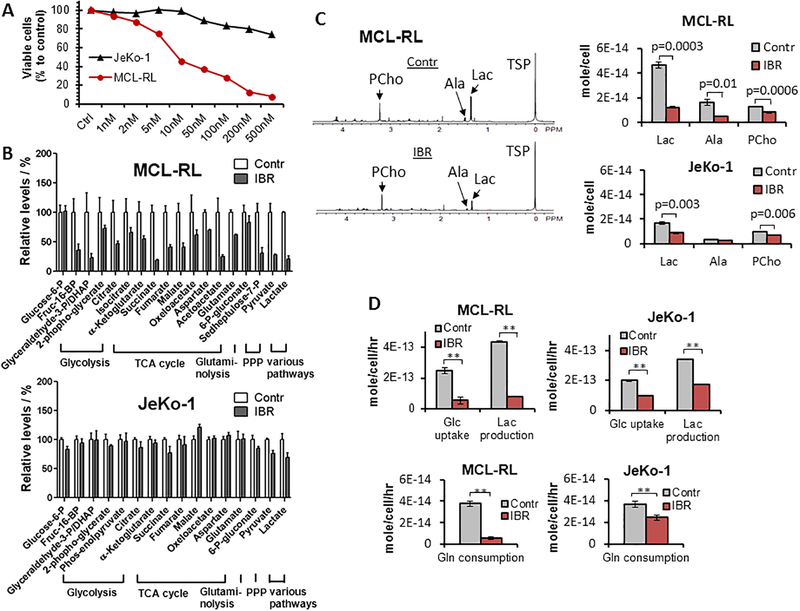
Figure 1. Effect of IBR on growth and metabolism of MCL cells.
(A) Impact of IBR on growth of the IBR-sensitive MCL-RL and IBR-poorly responsive JeKo-1 cell lines as determined by viable cell count. (B) Effect of IBR on intracellular concentration of key metabolites as measures by LC-MS. (C) Left; 1H MRS spectra of MCL-RL cells. The same number of cells (2.5×10⁷ cells) was used for each spectrum. TSP, Trimethylsilylpropanoic acid; Lac, lactate; Ala, alanine; Pcho, phosphocholine. Right; intracellular metabolite concentrations of MCL-RL and JeKo-1 cells determined by 1H MRS. (D) Top; extracellular glucose and lactate fluxes. Bottom; extracellular glutamine fluxes after IBR treatment. **p<0.002. Data were presented as mean±SEM for Fig 1B while mean±SD for Fig 1C and 1D.

