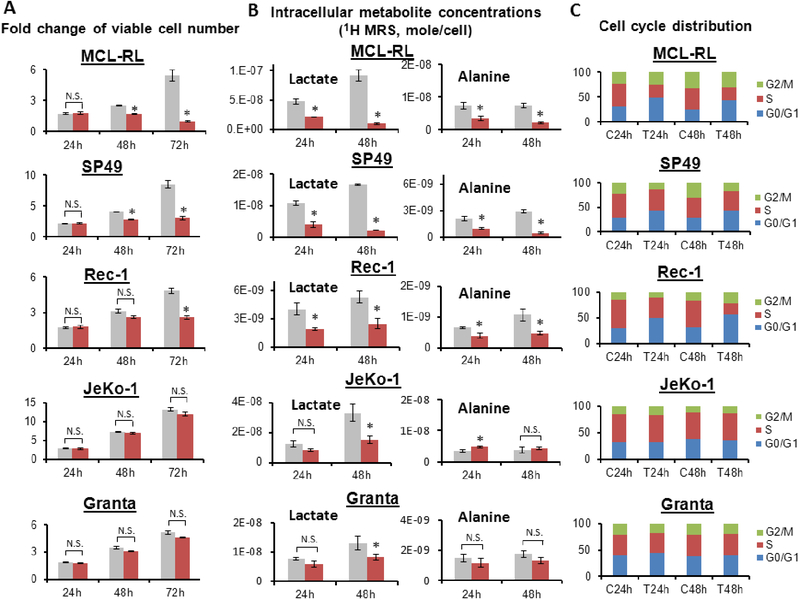
Figure 2. Kinetics of cell growth and metabolic changes upon IBR in various MCL cells.
(A) Viable cell number. (B) Intracellular 1H MRS metabolite concentrations. (C) Cell cycle distribution. *, p<0.05; N.S., statistically not significant. All data were presented as mean±SD. In Fig 2A and 2B, gray bar = control; red bar = IBR-treated.

