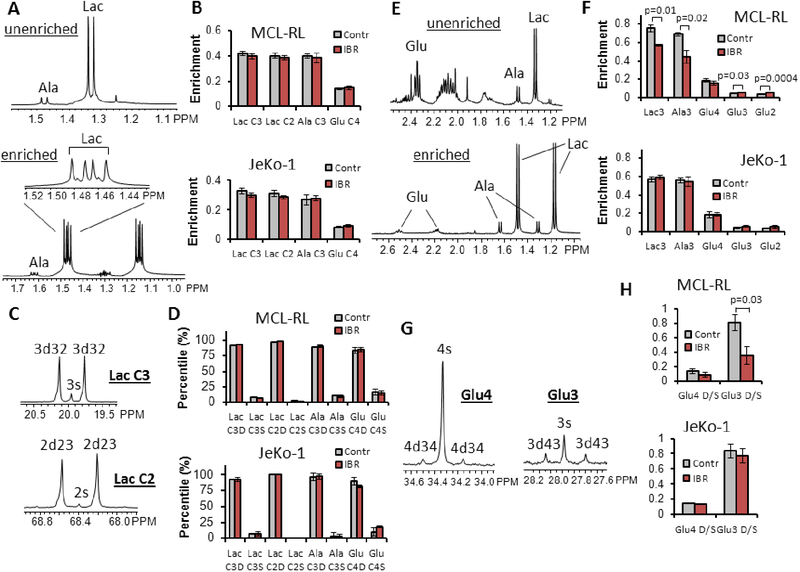
Figure 3. 13C MRS metabolomics with [1,2-13C2]- and [1,6-13C2]-glucose tracer.
13C labeling experiments were performed by incubating MCL cells either in the [1,2-13C2] glucose containing medium (A-D) or [1,6-13C2] glucose containing medium (E-H) for 8 h, and the steady state 13C MRS data of MCL-RL and JeKo-1 cells were obtained. (A) Indirect 1H[13C] MRS spectra of vehicle-treated MCL-RL cells. Among the six peaks of the spectrum, the two small peaks are from lactate molecules labeled only at the C3 position (3s) while the four large peaks are from lactate molecules labeled at both C3 and C2 positions (3d32) (29). (B) 13C enrichment of each metabolite with vehicle or IBR treatment. (C) Direct 13C MRS spectra of vehicle-treated MCL-RL cells. (D) The doublet to singlet ratios of C3- and C2-lactate, C3-alanine and C4-glutamate of vehicle- or IBR-treated cells. (E) Proton Observe Carbon Edited (POCE) MRS spectra of MCL-RL cells. Top: Unlabeled metabolite spectrum. Bottom: Labeled metabolite spectrum. Enrichment ratios of glutamate C3 and C2 positions were calculated by comparing signal intensities of glutamate C3, C2 positions with the signal at C4 position in the direct 13C MRS spectrum. (F) 13C enrichment ratios of intracellular metabolites from MCL-RL and JeKo-1 cells with or without IBR treatment. The enrichment of each metabolite was calculated from (labeled metabolite area) / (unlabeled + labeled metabolite areas) of the POCE spectra. To determine enrichment of Glu3 and Glu2, relative intensities of Glu3, Glu2 and Glu4 from direct 13C MRS and correction of nuclear Overhauser enhancement (NOE) factors was used. (G) A 1H-decoupled 13C MRS spectrum of MCL-RL cells. Left: Glutamate C4 position peaks. 4s, C4 singlet; 4d34, C3–4 doublet. Right: Glutamate C3 position peaks. 3s, C3 singlet; 3d43, C4–3 doublet. (H) Doublet to singlet ratios of Glu4 and Glu3 peaks of MCL-RL and JeKo-1 cells with vehicle and IBR treatment. All data were presented as mean±SD.

