
FIG 2.
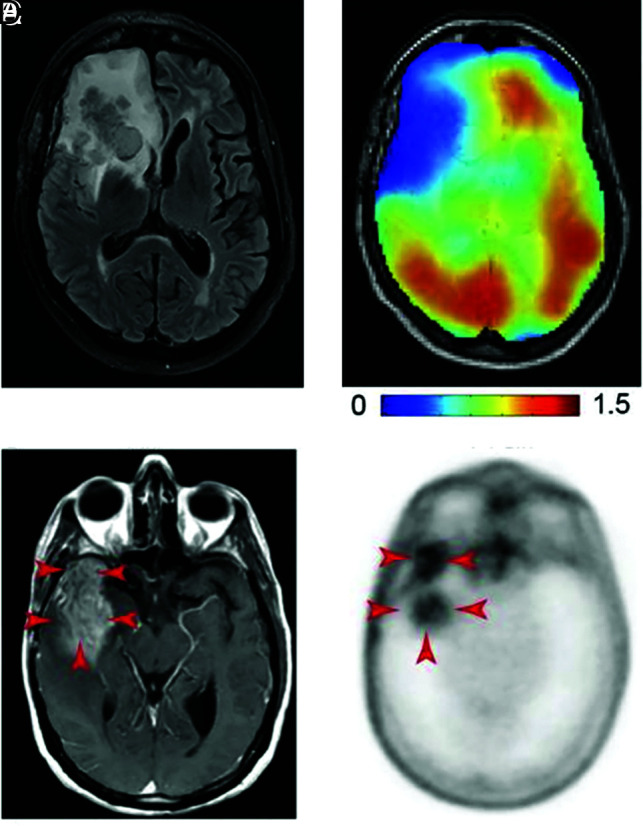
DMI and PET images of glutamine metabolism in gliomas. A, T2-weighted FLAIR MR image acquired in a patient with a glioblastoma with a tumor in the right frontal lobe. B, DMI maps of the same section position as in A showing 2H-labeled glutamine + glutamate, with lower concentrations in the tumor region compared with normal-appearing brain tissue. Color bar is in millimolar units. A and B reprinted with permission from DeFeyter et al41 and used under the CC BY-NC license 4.0. C, T1-weighted MR image with contrast enhancement acquired in a patient with glioblastoma. The tumor region is indicated with red arrows. D, 4-[18F]-FGln PET image acquired in the same patient as in C, with high uptake in the tumor region (red arrows) and minimal background uptake. C and D reprinted from Venneti et al,13 with permission from AAAS.