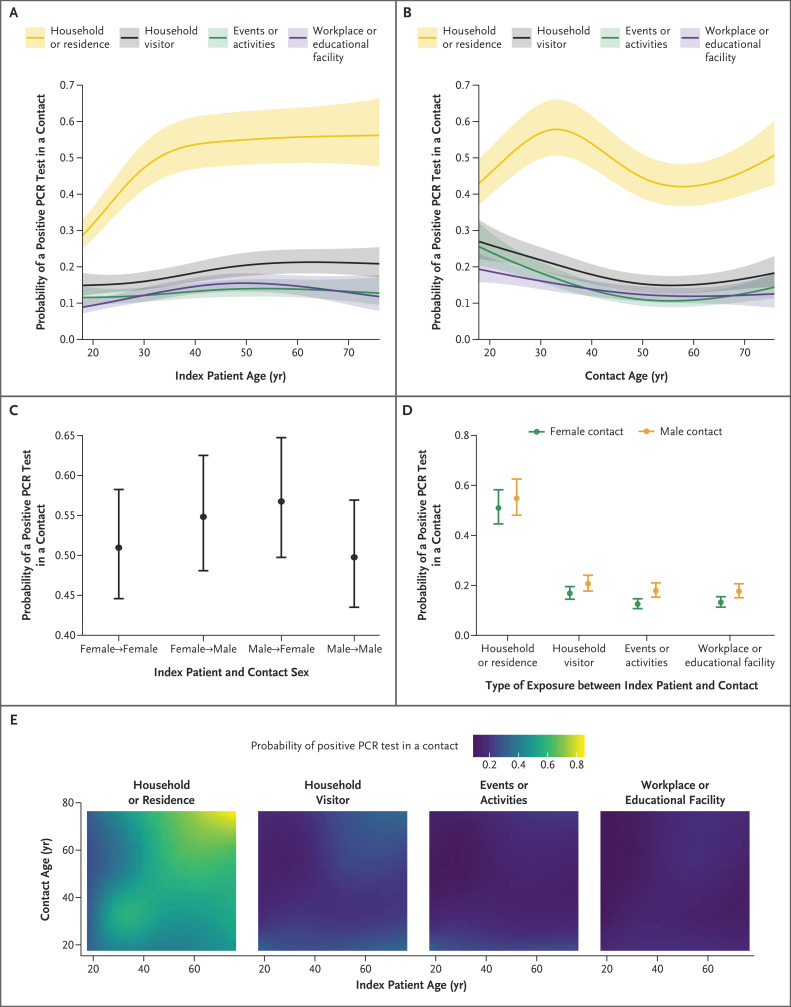
Figure 2. Estimated Probabilities of a Positive PCR Test among Contacts.
Shown are the estimated probabilities of a positive PCR test among contacts, according to the type of exposure between the index patient and contact and the age of the index patient (Panel A), the type of exposure and the age of the contact (Panel B), the sex of the index patient and contact (Panel C), the sex of the contact and the type of exposure (Panel D), and the type of exposure and age of the index patient and contact (Panel E). For each panel, all the other covariates are set to reference values for categorical values and to median values for continuous variables (i.e., the type of exposure is set to household or residence; for index-patient characteristics, age is set to the median, sex to female, vaccination status to unvaccinated, and symptom status to symptomatic; for contact characteristics, age is set to the median, sex to female, and vaccination status to unvaccinated). Local deprivation rank (socioeconomic disadvantage according to geographic area of residence) is adjusted for in the model along with the other covariates listed; local deprivation rank and the local incidence of SARS-CoV-2 infection and calendar time are set to the median. Shaded areas in Panels A and B and 𝙸 bars in Panels C and D indicate 95% confidence intervals.

