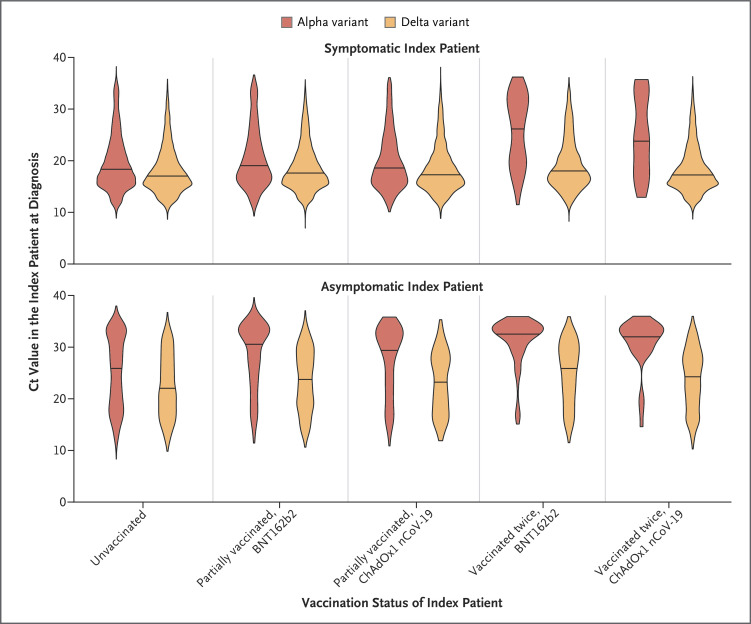
Figure 3. Distribution of Ct Values, According to Vaccination Status of the Index Patient, SARS-CoV-2 Variant, and Symptoms.
The violin plots show the observed frequency density of patients with a given result, and the solid line in each plot indicates the median. Cycle-threshold (Ct) values are indicative of viral load. Lee et al.15 describe details of equivalent viral loads in copies per milliliter (log10 viral load=12.0−0.328×Ct).

