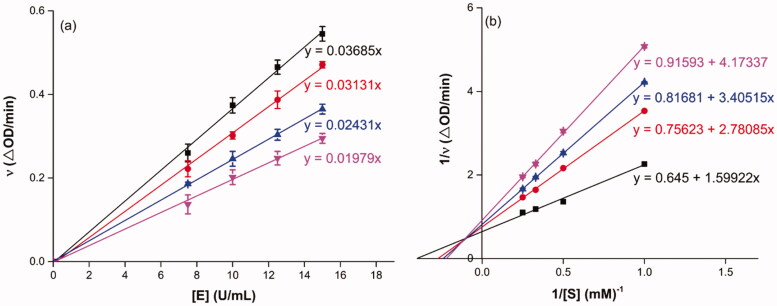
Figure 1.
Inhibition kinetics of 3a on α-glucosidase. (a) The plots of enzymatic reaction rate vs α-glucosidase concentration with or without the presence of 3a; (b) Lineweaver–Burk plots of enzymatic reaction rate versus substrate concentration with or without the presence of 3a (3a concentration: black line, 0 μM; red line, 0.25 μM; blue line, 0.45 μM; pink line, 0.5 μM).

