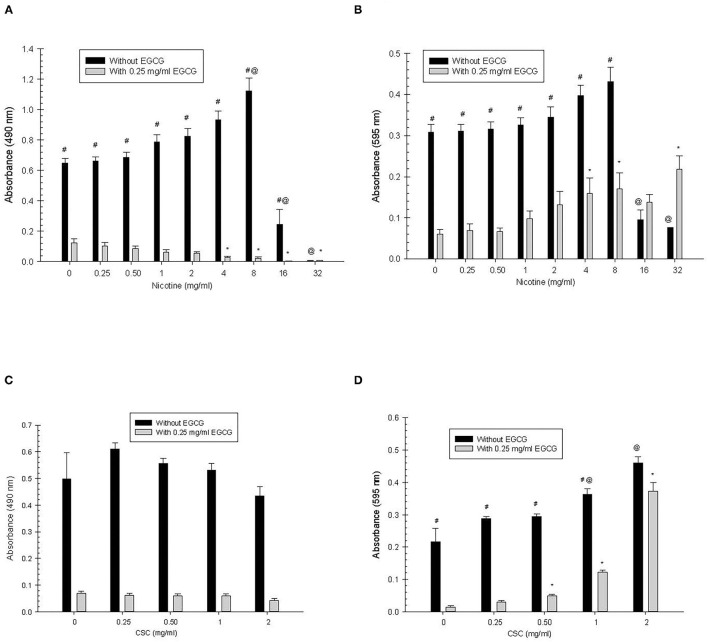
Figure 1.
Primary S. mutans biofilm (A,C) and total absorbance (B,D) nicotine/CSC exposure effects. #Indicates significant differences between growth with 0.25 mg/ml of EGCG and without EGCG. * and @ indicates significant differences between 0 mg/ml nicotine/CSC and other concentrations with 0.25 mg/ml of EGCG and without EGCG, respectively.

