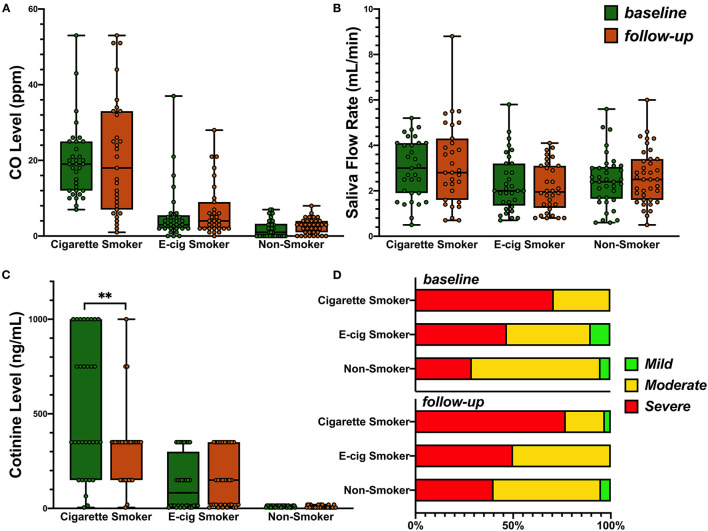
Figure 2.
(A) Levels of breath carbon monoxide (ppm) across the subjects in the cigarette smokers, e-cigarette smokers, and the non-smokers at base line and 6-month follow-up: 0–6 ppm, Borderline (BdL): 7–9 ppm, low addicted smoker (LAS): 10–15 ppm, moderate addicted smoker (MAS): 16–25 ppm, heavily addicted smoker (HAS): 26–35 ppm, and very heavily addicted smoker (VHAS): 36+ ppm. Group mean was used for ANOVA (p < 0.001) as no interaction of time and group was observed. (B) Saliva flow rate in three groups at base line and follow-up. Group mean was used for ANOVA (p = 0.02) as no interaction of time and group was observed. (C) Distribution of salivary cotinine levels in the participants of the three groups. Kruskal-Wallis test was used and p < 0.001 for both visits. Paired t-test (p = 0.002) was then used to evaluate the change over time in each group. P value less than 0.01 was summarized with 2 asterisks. (D) Prevalence of periodontal disease in all three groups from baseline to follow-up visit.

