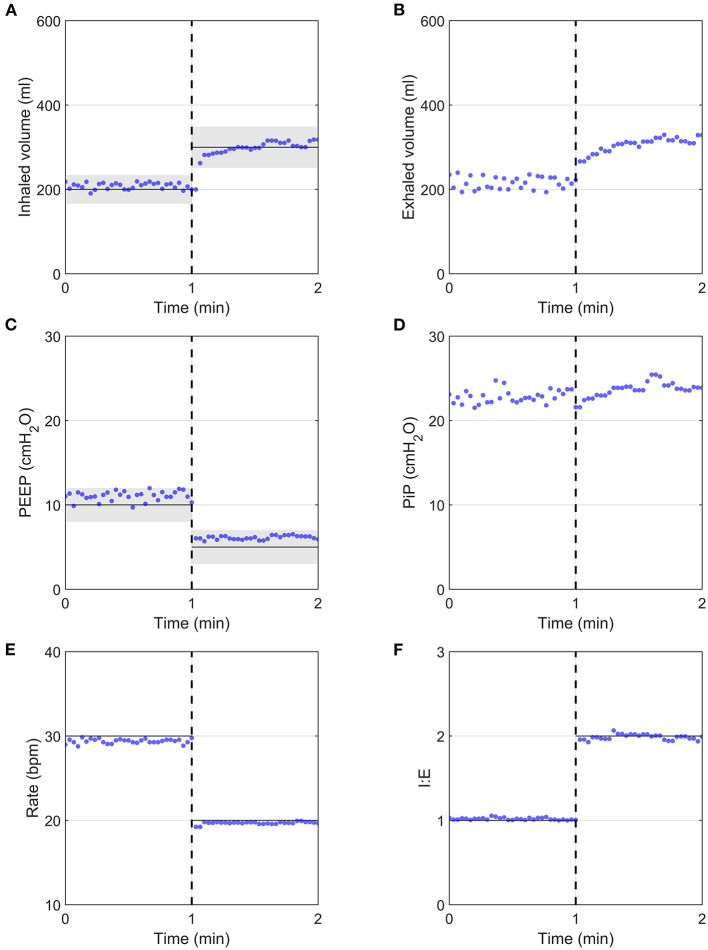
Figure 4.
System response after the programmatic changing of all clinical parameters simultaneously (dashed vertical lines), measured using the flow analyser. Input parameters are indicated by continuous black horizontal lines, with ISO 80601-2-12:2020 measurement uncertainties indicated by grey shaded regions, with ± (4 ml + 15% of target value) for volume and ±2 cmH2O for PEEP. (A) Inhaled volume, (B) Exhaled volume, (C) PEEP, (D) PiP, (E) Respiratory Rate, (F) I:E ratio.

