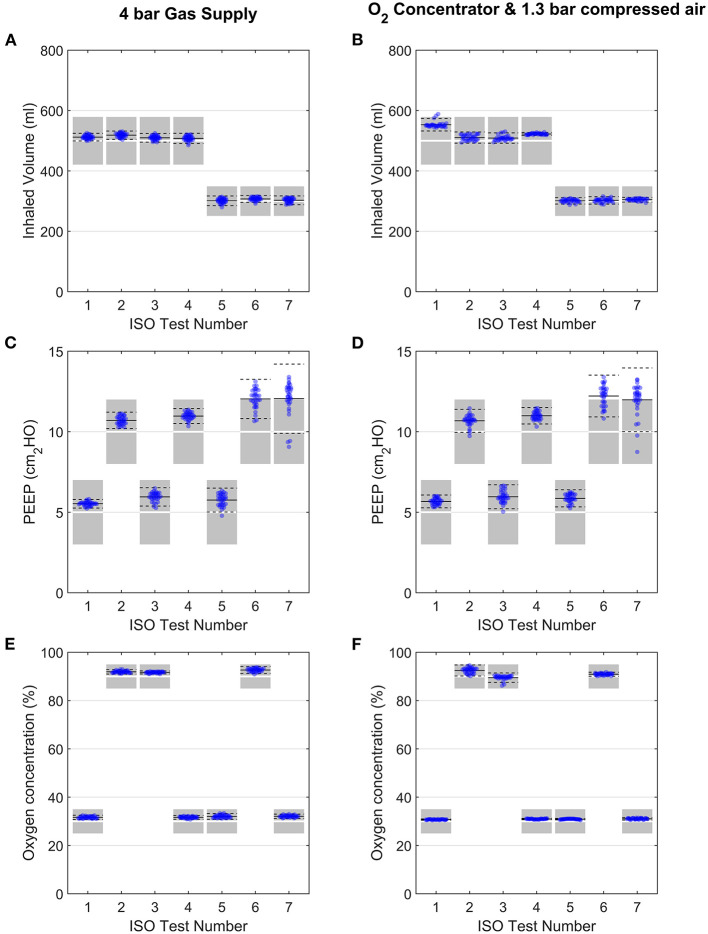
Figure 7.
Evaluation of performance under the ISO 80601-2-12:2020 testing schedule (Table 2). Variation in inhaled volume, PEEP and oxygen concentration are shown for each ISO test, when used with 4-bar gas supplies (A–C) or an oxygen concentrator (D–F). Each data point represents for 1 breath, with 31 breaths shown for each test. Data points shown are from breaths 4 to 36 (exclusive). In all panels, solid black lines and dashed black lines represent the average and ± 2SD of all datapoints. Shaded regions in panels (A,B,E,F) represent ISO 80601-2-12:2020 acceptable margins of uncertainty [± (4 ml + 15% of the measured value) for volume and ±5% for oxygen concentration], while those in panel (C) and (D) represent the ISO 80601-2-12:2020 acceptable uncertainty in PEEP pressure measurement (±2 cmH2O).

