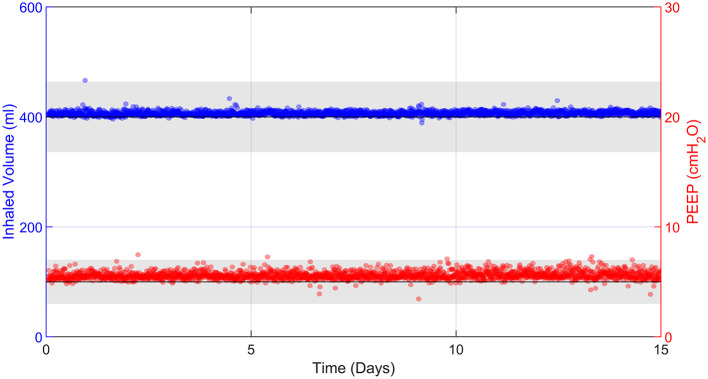
Figure 8.
15 days of uninterrupted ventilation using the prototype system and R20/C25 test lung. Each data point represents 30 s of averaged data every 10 min. Grey bands represent the ISO 80601-2-12:2020 acceptable uncertainty in Tidal Volume, ± (4 ml + 15% of the measured value), and the ISO 80601-2-12:2020 acceptable error in PEEP pressure measurements, ± 2 cmH2O.

