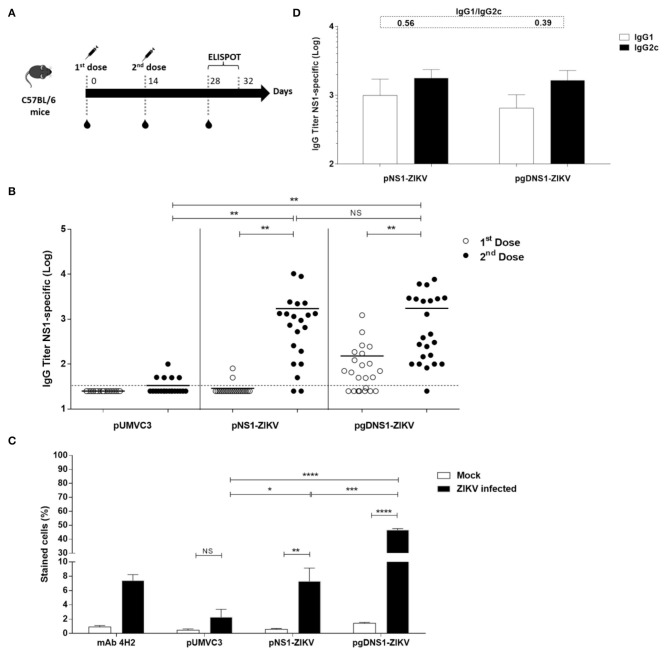
Figure 2.
Immune responses elicited in vaccinated immunocompetent mice. (A) Schematic representation of the vaccination regimen. C57BL/6 mice were i.m. immunized with two doses (50 μg/animal) of DNA vaccines administered with electroporation. Serum samples were collected 14 days after each vaccine dose and the specific T cell responses were measured 2 weeks after the last vaccine dose by ELISpot. (B) Anti-NS1 IgG dose-response profiles measured by ELISA with individual serum samples collected from vaccinated mice (pUMVC3 and NS1-ZIKV, n = 21/each group; pgDNS1-ZIKV, n = 23). Data are expressed as means (bars) and individual (symbols) IgG titers (Log10) obtained from three independent experiments. (C) Binding of anti-NS1 serum antibodies to the native ZIKV NS1 protein. Diluted pooled serum samples collected from vaccinated mice (n = 10) were reacted with ZIKV-infected VERO cells and analyzed by flow cytometry. The 4H2 mAb (specific to NS1) was used as a control. (D) IgG subclass responses measured 14 days after the second vaccine dose in the individual serum samples from immunized mice (n = 10). The IgG1/IgG2c ratios are indicated at the top of the figure. Statistical significance was calculated using Two/One-way ANOVA with Bonferroni correction. T-test was used to analyze the IgG subclass responses (*p < 0.05, **p < 0.01, ***p < 0.001, ****p < 0.0001, NS = not significant).

