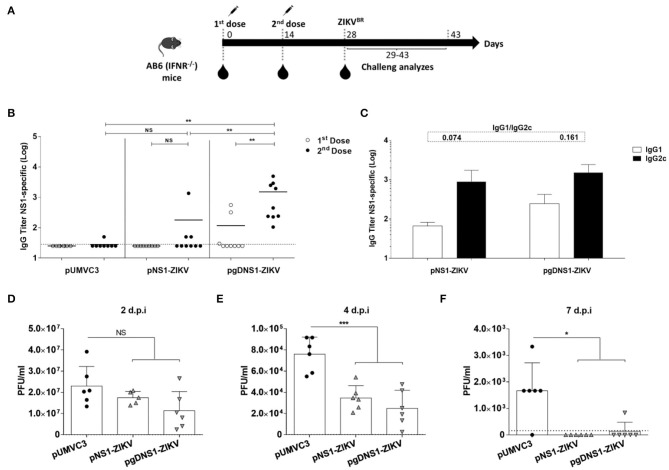
Figure 4.
Immune responses and protective immunity induced by the DNA vaccines in immunodeficient mice. (A) Schematic representation of the vaccination regimen. AB6 mice were immunized twice by i.m. route in association with electroporation. Serum samples were collected 14 days after each vaccine dose. Mice were i.v. infected with 106 PFU of ZIKVBR 2 weeks after the last vaccine dose and monitored for viremia, morbidity and mortality for 15 days. (B) Total and (C) IgG subclass anti-NS1 responses were measured by ELISA with serum samples collected from immunized mice (n = 9). Data were obtained from three independent experiments and are expressed as mean (bars) ± SEM or individual values (symbols) of antibodies titers (Log10). The IgG1 and IgG2c ratios are indicated at the top of the figure. (D–F) 2 weeks after the last dose, immunized mice (n = 5) were i.v. challenged with ZIKV (106 PFU/animal). Viremia is expressed in mean ± SD of PFU/ml, measured individually until day seven after infection. The results are representative of three independent experiments. Statistical significance was calculated using Two/One-way ANOVA with Bonferroni correction. T-test was used to analyze the IgG subclass results (*p < 0.05, **p < 0.01, ***p < 0.001, NS = not significant).

