
Figure 5.
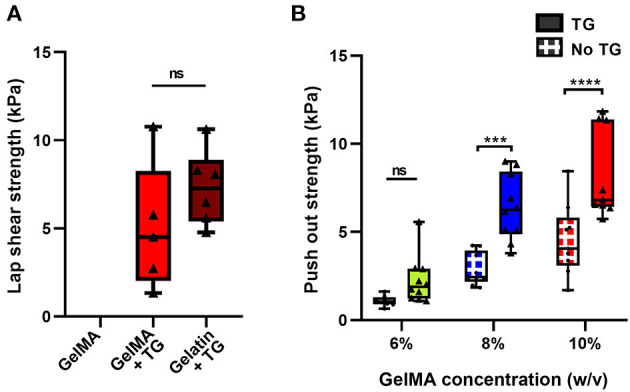
Quantification of the adhesive ability of GelMA with transglutaminase against cartilage tissue (A) Lap shear analysis of 10% GelMA with transglutaminase against bovine cartilage, in comparison to GelMA only and 10% gelatin with transglutaminase as controls. Individual data points are plotted with box and whisker plots indicating the median and interquartile ranges. Significance was assessed with an unpaired t-test. (B) Push out test results for three concentrations of GelMA with and without transglutaminase. Individual data points are plotted with box and whisker plots indicating the median and interquartile ranges. Significance was assessed with two-way ANOVA and Bonferroni post-hoc test. ***p < 0.001, ****p < 0.0001. Triangle symbols and solid shaded boxes are used to indicate samples that contained transglutaminase, and circle symbols with hatched boxes are used to indicate controls.