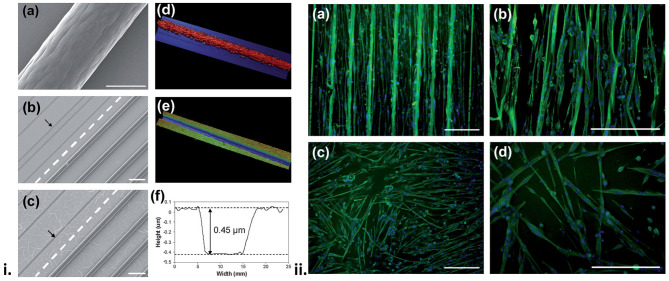
Figure 5.
(i) Surface profile of the biosynthetic cell culture platform. Scanning electron microscopy (SEM) images of (a) a 75:25 PLA:PLGA fibre, and (b,c) hybrid platforms made from 75:25 PLA:PLGA fibres and PPy doped with pTS (b) and HA (c). The broken line separates the area on the PPy substrate where the fibres have been removed (pointed by the arrows). Also shown are profilometry images of the hybrid platform in the (d) presence and (e) absence of PLA:PLGA fibres, and (f) height profile obtained from image (e). (ii) Fluorescence images of differentiated, multinucleated desmin (green) expressing myotubes on PPy/pTS substrate (a,b) with and (c,d) without the presence of PLA:PLGA fibre array. Cell nuclei are shown in blue. Scale bars are 200 mm. Reproduced with permission from Razal et al. (168).

