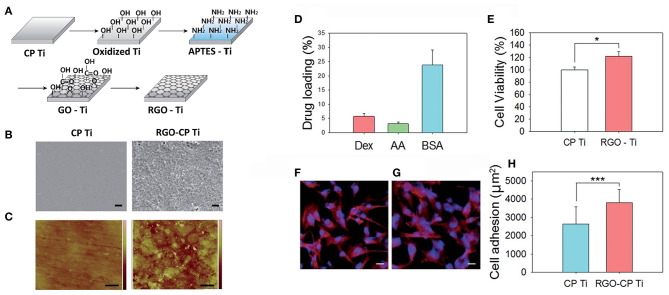
Figure 9.
(A) Schematic illustration for the preparation of rGO-Ti. (B) SEM images of Ti and rGO-Ti (scale bar = 2 μm). (C) AFM images of Ti and rGO-Ti (scale bar = 500 nm). (D) Drug loading (%) on rGO-Ti. (E) Relative cell viability on Ti and rGO-Ti. Confocal microscopic images of F-actin stained preosteoblasts on (F) Ti and (G) rGO-Ti (scale bar = 25 μm). (H) Cell adhesion area determined from the region of F-actin fluorescence (*P ≤ 0.05 and ***P ≤ 0.001). Reproduced with permission from Jung et al. (130).

