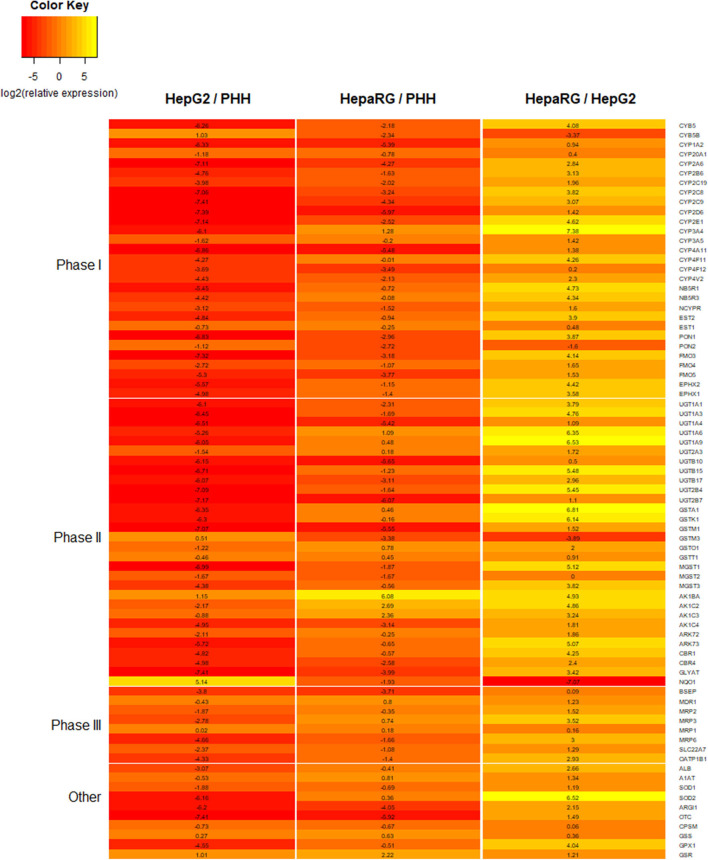
Figure 6.
Heatmap comparing the expression for a number of proteins involved in xenobiotic metabolism and liver function. Expression data is for 2D monolayers: HepG2 relative to primary human hepatocytes (PHHs), HepaRG relative to PHHs, and HepaRG relative to HepG2. Data is reported as log2 of relative expression and sourced from a previously published study (116).

