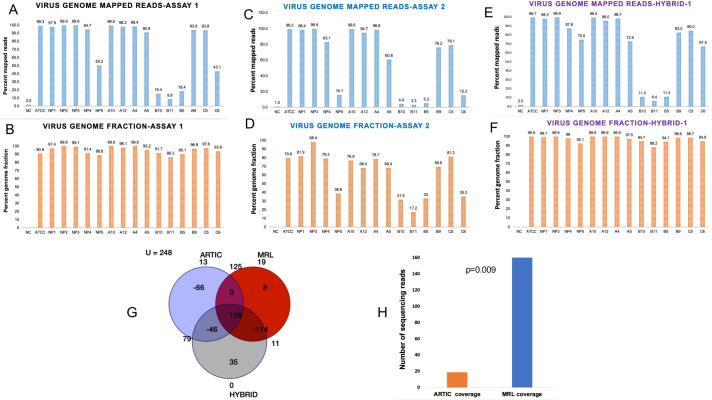
Fig 2. Virus genome mapped reads and genomic fraction covered in various assays.
Percentage of virus genome mapped sequencing reads (A) and virus genome fraction covered with ARTIC primers (B). NC represents the negative control (Human Dendritic Cell RNA), PC represents the positive control (VR1986D-ATCC SARS-CoV-2 RNA), and fifteen nasopharyngeal swab RNAs from COVID-19 positive patients. Panels C and D, show the percentage of viral genome mapped sequencing reads (C) and virus genome fraction covered (D) with MRL primers. Data in panels E & F show the percentage of the viral genome mapped sequencing reads (E) and virus genome fraction covered (F) in ARTIC plus MRL Hybrid data set. The NP2 sample could not be analyzed with MRL primers due to limited sample material. Panel G: Venn-diagram summarizes the number of mutations that were uniquely or commonly detected by individual (ARTIC or MRL) primers and hybrid analysis. Panel G: Shows average read depth on ambiguous mutations in ARTIC assay. T-test p value for read depth comparison is shown.

