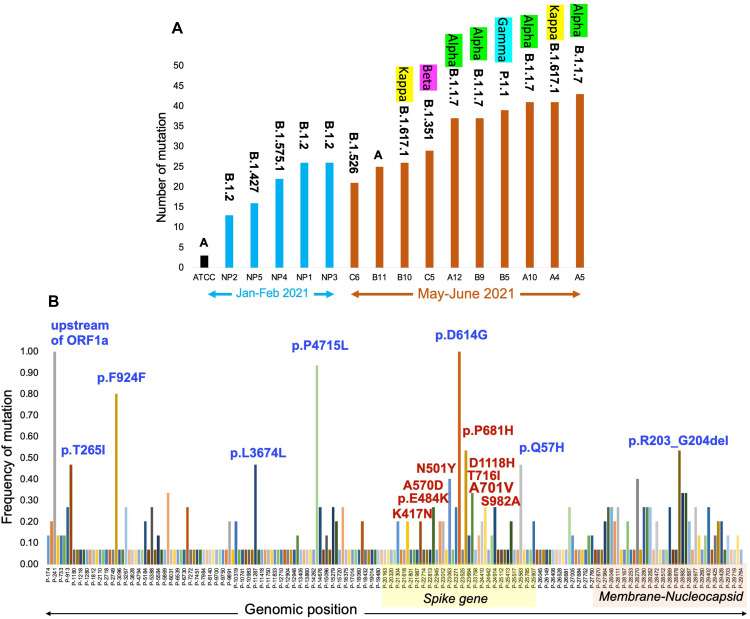
Fig 4. Mutation load and pangolin lineage assignment in study samples.
Panel A shows number of mutations detected in ATCC RNA and fifteen patient samples in Hybrid data set. The x-axis shows the study samples. ATCC RNA is shown in black bar. NP1-NP5 samples shown as blue bars indicate samples collected during the month of Jan-Feb 2021. Samples C6-A5 were collected during the month of May-June 2021 are shown with red bars. The y-axis shows total number of mutations detected in each study sample. Pangolin lineage and WHO label for that lineage are shown on the top of individual bar. Panel B show frequency distribution of 214 high confidence mutations in the study samples. The x-axis shows genomic position of detected mutations. The y-axis shows the frequency of each mutation in the study sample. Each bar represents an individual mutation. In this study’s cohort, 8 high bars show mutations with >40% frequency. Amino acid alterations are shown on the top of each bar for the 8 most common mutations (Blue font color) and several variants of concern and variants of interest in spike gene (Red font color).

