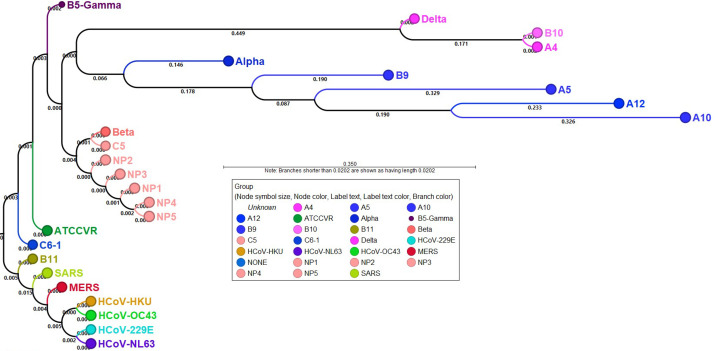
Fig 5. Phylogenetic analysis on study specimens.
A maximum likelihood tree was constructed to explore the phylogenetic relationship between SARS-CoV-2, SARS-CoV-1, MERS and endemic coronaviruses (HCoV-NL63, HCoV-229E, HCoV-OC43, HCoV-HKU). The whole genome sequences for SARS, MERS and endemic coronaviruses were downloaded from NCBI. The numbers along the branches mark the bootstrap values percentage out of 1000 bootstrap resamplings. Samples NP1-NP5 that represent sampling from Jan-Feb 2021 form a clade and are highlighted with pink color. ATCCVR RNA shown in green font color and C6 and B11 patient sample are part of separate clade. Sample B9, A5, A12, and A10 shown in blue label font color cluster closely on tree. Dots labels as Alpha, Beta and Delta represent reference genomes for respective strains downloaded from NCBI.

