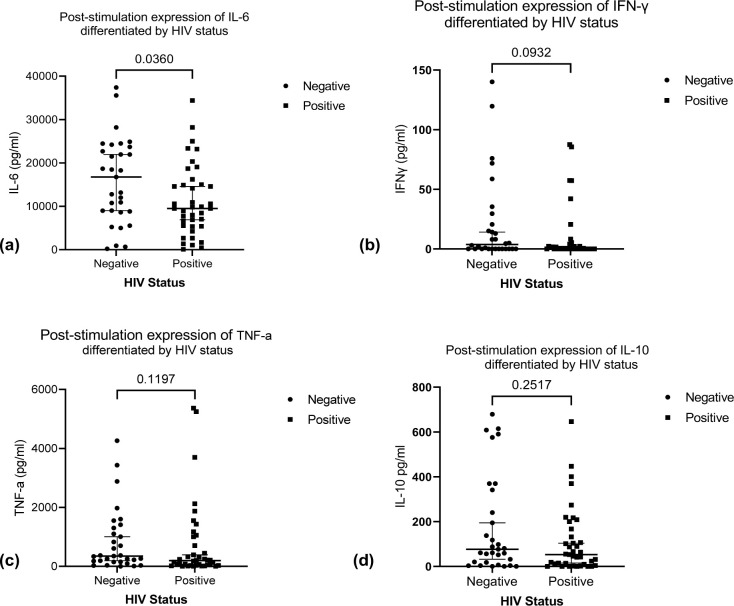
Fig 2.
(a) Shows the expression of IL-6 differentiated by HIV serostatus. Median (IQR) IL-6 in HIV negative vs HIV positive is 16,757 (8,827–23,689 pg/ml) vs 9,508 (5,414–15,008 pg/ml), p value P = 0.0360. The expression of IL-6 was significantly higher in HIV negative TB patients. (b) Shows a comparison of stimulation expression of IFNγ in HIV negative vs HIV positive TB patients, median (IQR) IFNγ in HIV negative vs HIV positive was 3.755 (0–22.82 pg/ml) vs 0 (0–3.6 pg/ml) respectively, p value = 0.0932. (c) Shows a comparison of the expression of TNF-α in HIV positive vs HIV negative TB patients. The median (IQR) of TNF-a in HIV positive vs HIV negative patients was 351.1(155.9–1,301 pg/ml) vs 198.3.9 (36.35–1,0065 pg/ml) respectively p value = 0.1197. (d) Shows expression of IL-10 in HIV positive vs HIV negative TB patients. The median (IQR) of IL-10 in HIV negative vs HIV positive 76.75 (17.62–341.2 pg/ml) vs 52.56 (9.38–166.8 pg/ml), p value = 0.2517.

