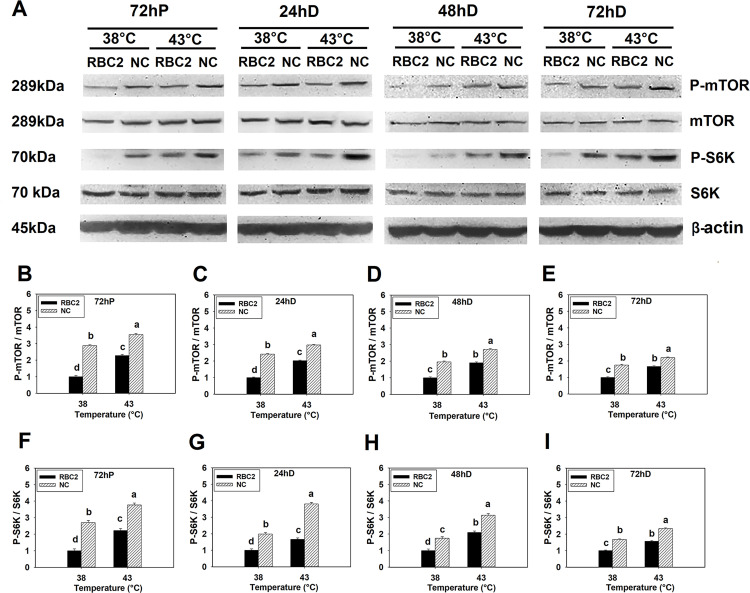
Fig 1. Effect of heat stress on the phosphorylation of mTOR and S6K in RBC2 and NC line SCs.
(A) Protein levels of the unphosphorylated and phosphorylated forms of mTOR and S6K, and an internal control β-actin in SCs from the RBC2 and NC lines cultured at 38° or 43°C determined by western blot analysis at 72 h of proliferation (72hP) and 24 h (24hD), 48 (48hD), and 72 h (72hD) of differentiation. Molecular weight and name of each target protein is shown on the left and right side of each figure, respectively. The densitometric ratio of phosphorylated to unphosphorylated mTOR was analyzed in each treatment group at 72hP (B), 24hD (C), 48hD (D), and 72hD (E). The densitometric ratio of phosphorylated to unphosphorylated S6K was analyzed in each treatment group at 72hP (F), 24hD (G), 48hD (H), and 72hD (I). Each graph bar represents a mean ratio, and each error bar represents a standard error of the mean value. Mean values without the same letter are significantly different (P ≤ 0.05).

