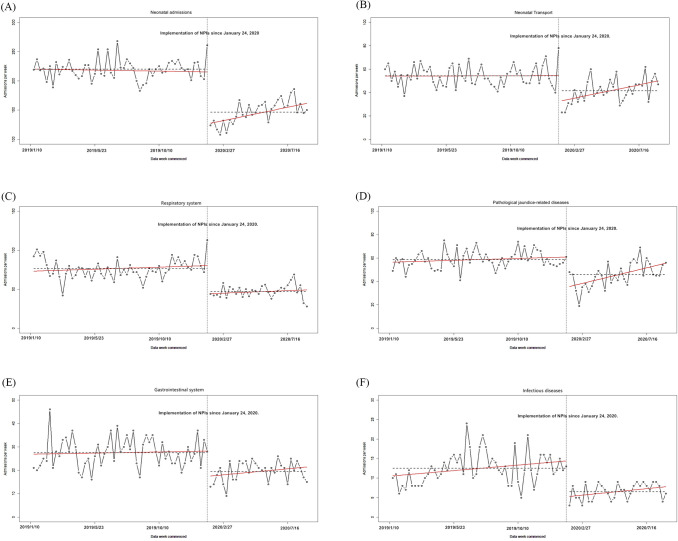
Fig 2. Impact of interventions on attendances and disease spectra based on segmented regression analysis.
(A) Neonatal admissions (B) Neonatal Transport (C) Respiratory system (D) Pathological jaundice-related disease (E) Gastrointestinal system (F) Infectious diseases.The black points in the plot represent weekly changes in the volume of attendances and disease spectra. The red fitted lines are from Prais-Winsten estimates. Dashed horizontal lines indicate the level change.

