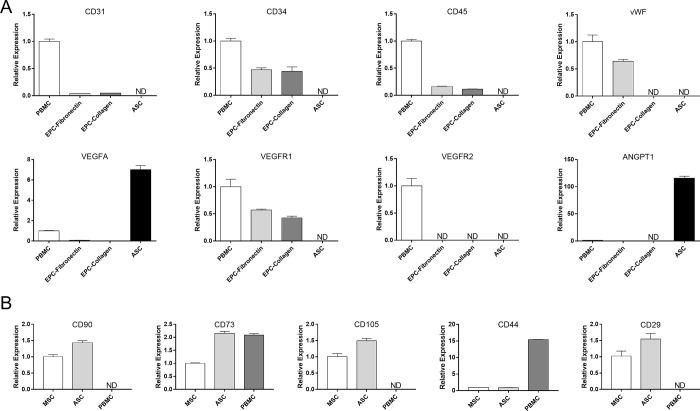
Fig 2. Molecular phenotyping of EPCs and ASCs isolated from rabbits.
(A) The relative expression of surface markers and angiogenic factors in PBMCs, EPCs, and ASCs was evaluated with qPCR. (B) The transcription of key stemness markers in ASCs were evaluated with qPCR. The rabbit bone marrow mesenchymal stem cells (MSC) and rabbit PBMC were used as controls. Levels below the detection limit are depicted as ND. Data are expressed as mean ± standard errors of the mean (SEM).

