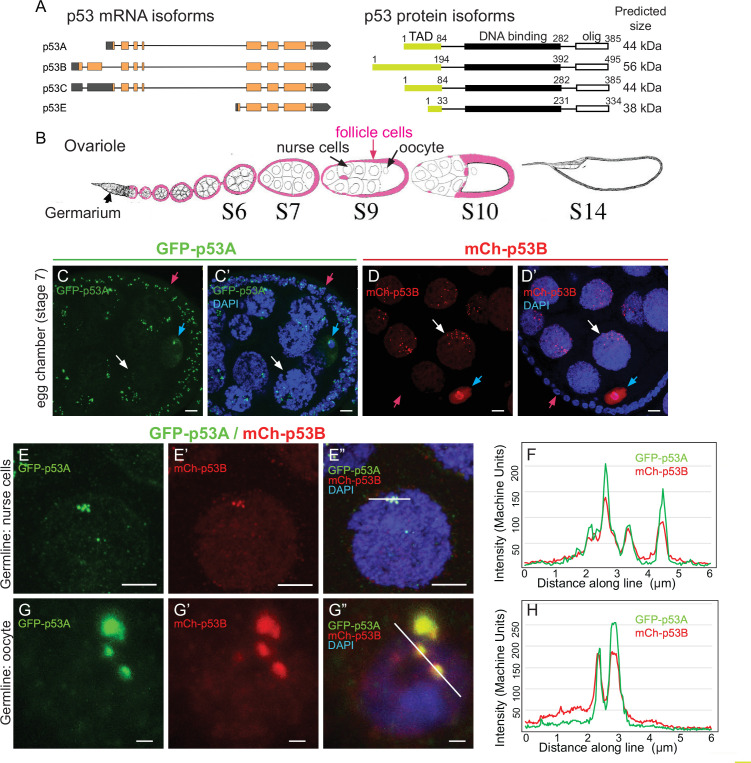
Figure 1. The p53B protein isoform is expressed in the germline where it colocalizes with p53A in nuclear bodies.
(A) Drosophila p53 mRNA and protein isoforms. Left: The four p53 mRNA isoforms with introns as lines, translated regions of exons as orange boxes, and 5’ and 3’ untranslated regions as black boxes. Right: The p53 protein isoforms encoded by those four mRNA isoforms. Numbers indicate amino acid coordinates of transactivation domain (TAD) (green), DNA-binding domain (black) and oligomerization domain (white). p53A and p53C mRNAs encode the same protein. (B) Drosophila oogenesis: One ovariole with germarium at anterior (left) and egg chambers migrating posteriorly (to right) as they mature. Arrows indicate germline nurse cells and oocyte and epithelium of somatic follicle cells (pink) in one egg. (C-D’) Immunofluorescent detection of GFP-p53A (C, C’) or mCh-p53B (D, D’) expression in stage seven egg chambers, with DNA counterstained with DAPI (blue). Follicle cells (red arrow), nurse cells (white arrow), oocyte (blue arrow). Scale bar 10 μm (E-E”) Colocalization of GFP-p53A and mCh-p53B in subnuclear foci of nurse cells. Scale bars 5μm. (F) Quantification of GFP-p53A and mCh-p53B fluorescence along the 6 μm line shown in E”. (G-G”) Colocalization of GFP-p53A and mCh-p53B in subnuclear foci of an oocyte. Scale bars 1 μm. (H) Quantification of GFP-p53A and mCh-p53B fluorescence along the 6 μm line shown in G”.


