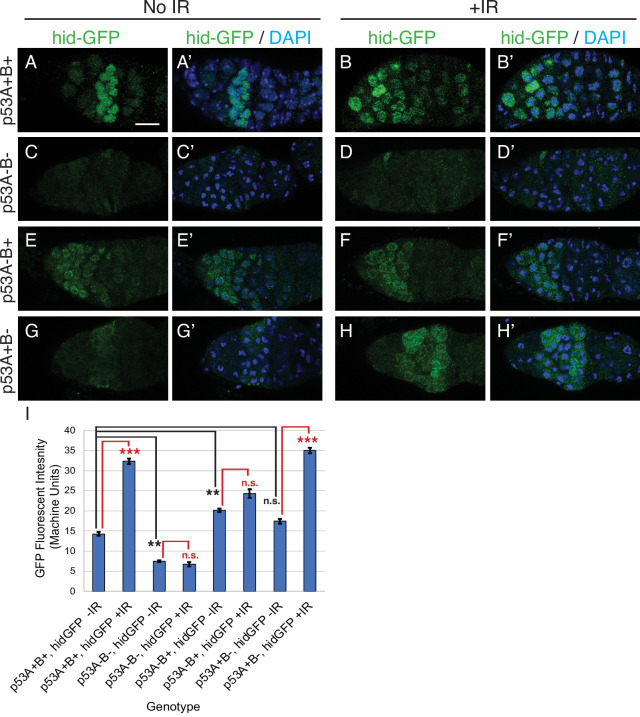
Figure 4. p53A is necessary and sufficient for IR-induced expression of proapoptotic genes in the germline.
(A-H’) Confocal micrographs of the expression of the p53 activity reporter, hid-GFP, in germaria of females with the indicated p53 allele genotypes (rows), without IR (left two columns) or with IR (right two columns). Shown are single channel hid-GFP (A–H) and double label with DAPI (A’-H’). Scale bar in panel A is 10 μm for all panels. (I) Quantification of hid-GFP fluorescent intensity in the germaria of females with the indicated p53 genotypes. Bars represent mean fluorescent intensity and error bars S.E.M. from three biological replicates. Statistical significance of expression differences between irradiated and unirradiated within a genotype are indicated by red font and lines, and comparison of nonirradiated p53 wild type to all nonirradiated p53 mutants are indicated by black font and lines. ***: p < 0.001, **: p < 0.01, n.s.: not significant based on ANOVA.
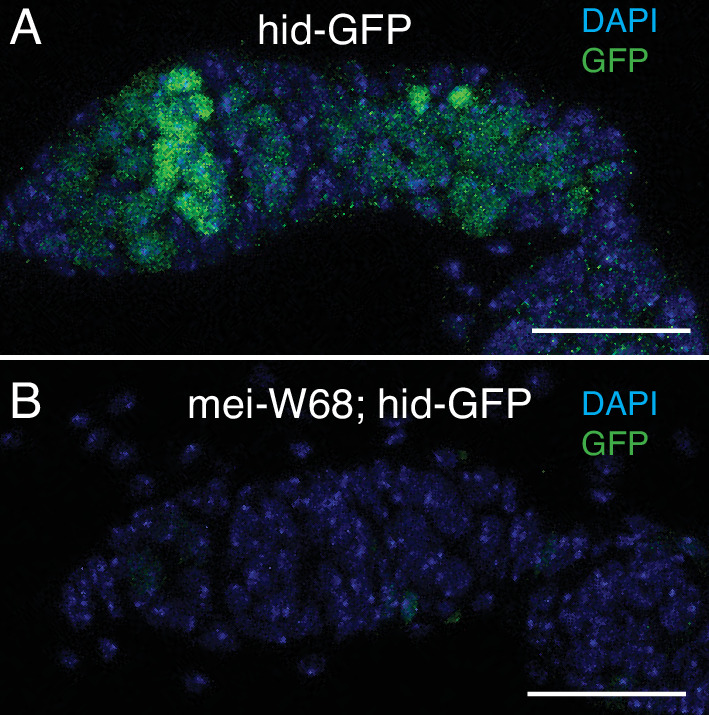
Figure 4—figure supplement 1. hid-GFP expression in region 2a responds to meiotic DNA breaks.


