. 2022 Jan 13;11:e61389. doi: 10.7554/eLife.61389

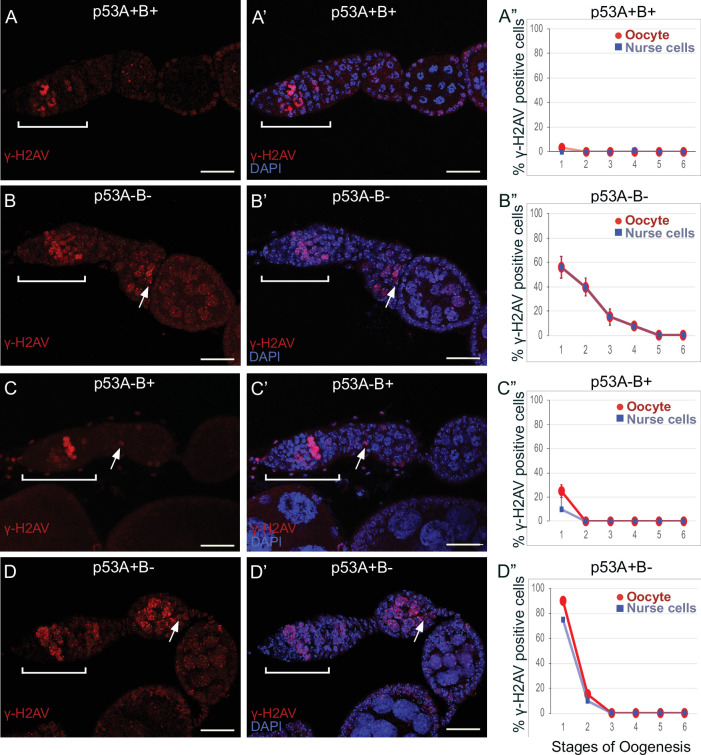
Figure 6. p53A and p53B mutants have persistent germline DNA damage.

(A-D’) Images of ovarioles of indicated genotypes immunolabeled with anti-γ-H2Av (red) (A–D) to detect DNA breaks, and counterstained with the DNA dye DAPI (blue) (A’-D’). The ovarioles are oriented with the anterior germarium to left (square bracket). Scale bars are 25 µm. (A”-D”) Quantification of percent of ovarioles with γ-H2Av-positive nurse cells (blue squares) and oocyte (red ovals) for the indicated genotypes. Values are means of three biological replicates and >20 ovarioles, with error bars representing S.E.M. Values with low variance have very small error bars that are not visible in the graphs. See Figure 6—figure supplement 1 for higher magnification images of germaria, and Supplementary file 1 for p values.

Figure 6—source data 1. Quantification of persistent DNA breaks by stage for Figure 6.
elife-61389-fig6-data1.xlsx (186.8KB, xlsx)

Figure 6.

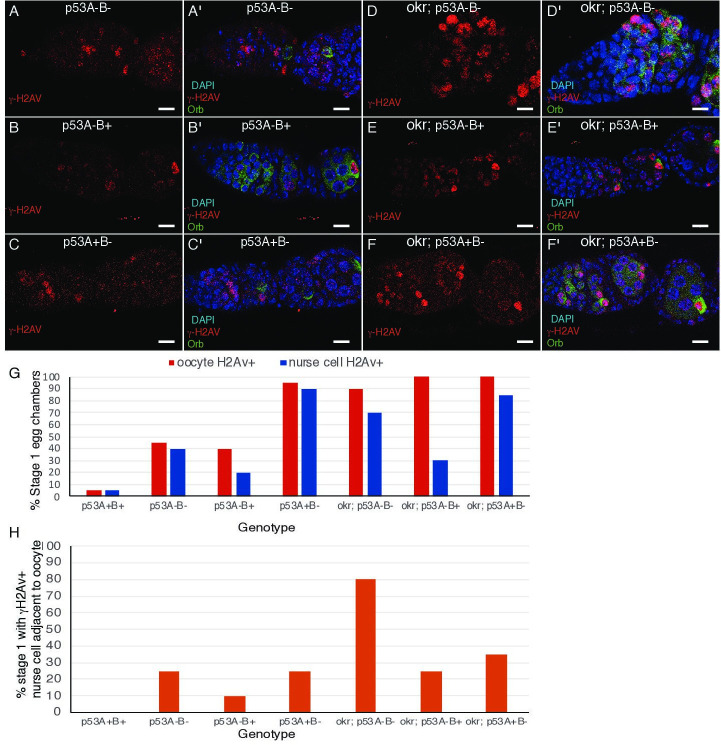
Figure 6—figure supplement 1. Double labeling for oocyte marker Orb and γ-H2Av in stage 1.

Figure 6—figure supplement 1.

(A-F’) Images of germarium and stage one labeled for γ-H2Av (red) and oocyte marker Orb (green) (A–F), and with DAPI DNA stain (blue) (A’-F’). (G) Quantification of percent stage one with γ-H2Av and Orb positive oocyte. (H) Quantification of percent stage one with a γ-H2Av -bright nurse cell adjacent to a Orb-positive oocyte. n = 20 ovarioles for each genotype.
Figure 6—figure supplement 1—source data 1. Quantification of DNA breaks in orb-lableled ovaries of Figure 6—figure supplement 1.
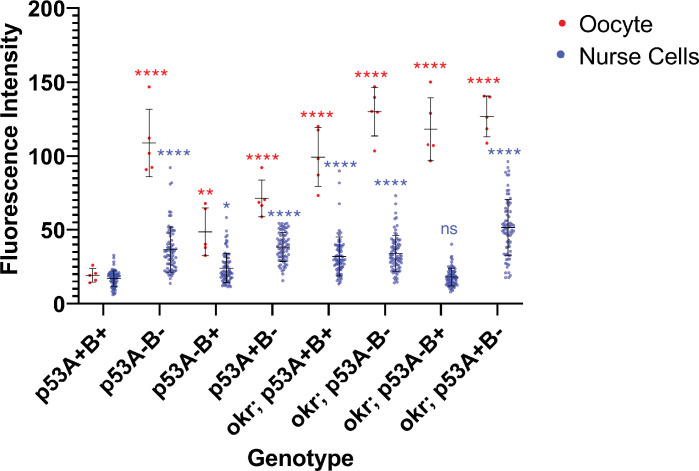
Figure 6—figure supplement 2. Quantification of γ-H2Av fluorescence intensity in oocytes (red) and nurse cells (blue) of stage one egg chambers.

Figure 6—figure supplement 2.

Each dot represents a single oocyte or nurse cell. Horizontal lines represent mean and standard deviation. Asterisks represent adjusted p values of a two-way, pair-wise ANOVA computed through a Tukey test between p53A+B+ (wild type) and all other genotypes for oocyte (red asterisks) and nurse cells (blue asterisks). * p < 0.05; **p < 0.01; ***p < 0.01; ****p < 0.0001. Statistical analyses were performed using GraphPad Prism (version 9.1.2). See Supplementary file 2 for p values.
Figure 6—figure supplement 2—source data 1. Quantification of DNA breaks per cell for Figure 6—figure supplement 2.
Figure 6—figure supplement 3. DNA repair foci in p53 mutants depends on DNA meiotic breaks.
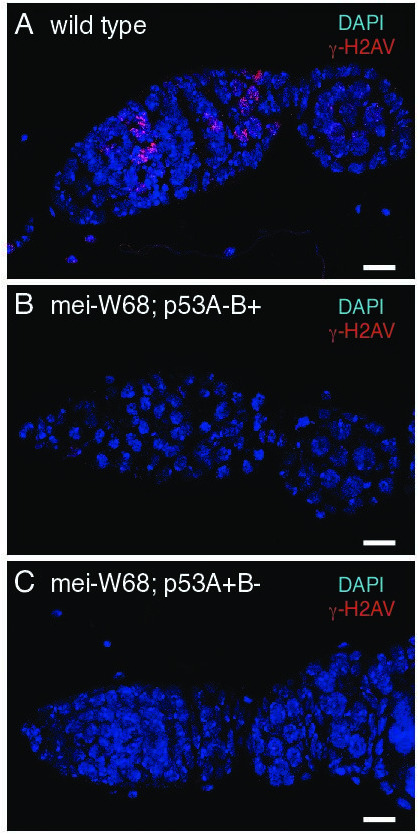
Figure 6—figure supplement 3.

γ-H2Av labeling of wild type (A), mei-W681/ Df(2R)BSC782; p53A2.3 (B), and mei-681/Df(2R)BSC782; p53B41.5 (C).