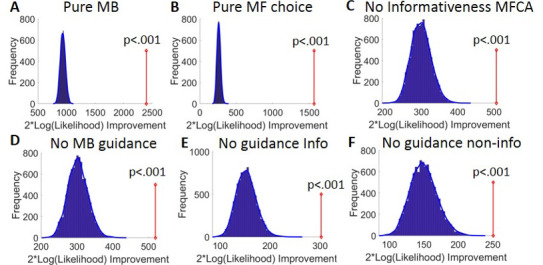
Appendix 1—figure 7. Model comparison results.

(A) Results of the bootstrap-GLRT model comparison for the pure model-based (MB) sub-model. The blue bars show the histogram of the group twice log-likelihood improvement (model vs. sub-model) for synthetic data simulated using the sub-model (10,000 simulations). The blue line displays the smoothed null distribution (using Matlab’s ‘ksdensity’). The red line shows the empirical group twice log-likelihood improvement. p-Value reflects the proportion of 10,000 simulations that yielded an improvement in likelihood that was at least as large as the empirical improvement. (B–E) Same as (A), but for the pure model-free (MF) choice, the no informativeness effects on MF credit assignment (MFCA), the no MB guidance for MFCA, the no MB guidance for the informative destination, and the no MB guidance for the non-informative destination sub-models.
