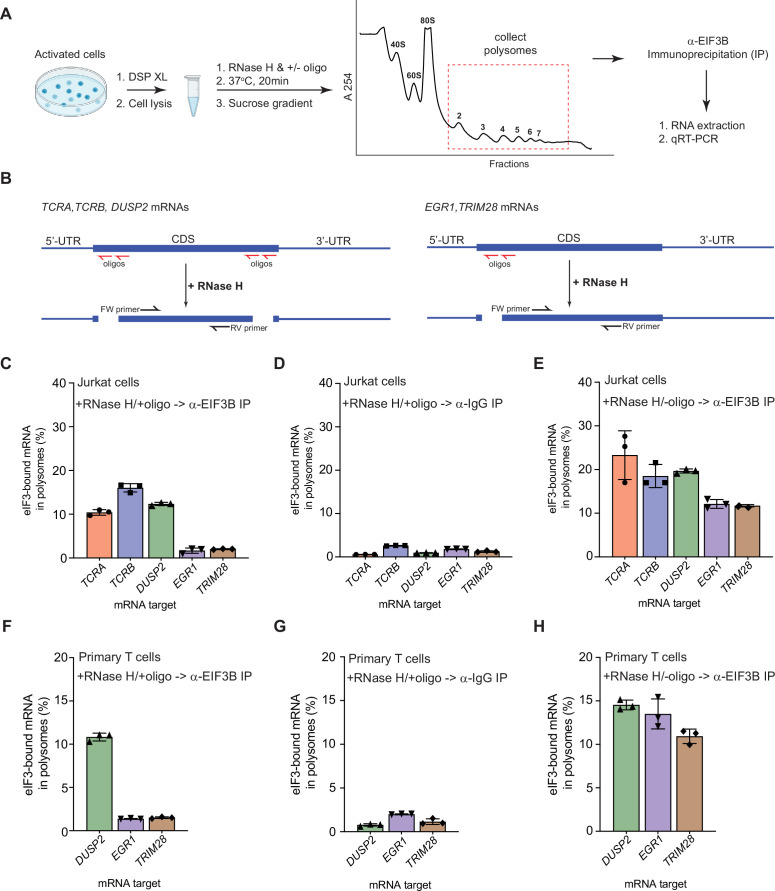
Figure 2. eIF3 remains bound to the coding sequences (CDS) of pan-mRNAs independent of their 5’-UTR and 3’-UTR elements in actively translating ribosomes.
(A) Schematic outlining the RNase H-based assay of eIF3 interactions with mRNAs in polysomes. DSP refers to the dithiobis (succinimidyl propionate) crosslinking agent. Oligos, DNA oligos designed for RNase H-mediated targeting and cleavage of specific mRNAs. (B) Strategy for detecting mRNA fragments released by RNase H digestion. Red arrows denote DNA oligos for RNase H-mediated targeting of mRNAs. RT-qPCR primers (black) were used to detect the CDS regions of the mRNAs. (C) Amount of eIF3-bound mRNA co-immunoprecipitated by an anti-EIF3B antibody (Lee et al., 2015), from polysome fractions of Jurkat cells treated with RNase H and oligos targeting the CDS-UTR junctions (red arrows diagrammed in panel B). (D) Amount of eIF3-bound mRNA co-immunoprecipitated with IgG beads, from polysome fractions of Jurkat cell lysate treated with RNase H and oligos targeting the CDS-UTR junctions. (E) Amount of eIF3-bound mRNA co-immunoprecipitated by the anti-EIF3B antibody, from polysome fractions of Jurkat cell lysate treated only with RNase H. (F) Amount of eIF3-bound mRNA co-immunoprecipitated by an anti-EIF3B antibody, from polysome fractions of primary human T cells treated with RNase H and oligos targeting the CDS-UTR junctions (red arrows diagrammed in panel B). (G) Amount of eIF3-bound mRNA co-immunoprecipitated with IgG beads, from polysome fractions of primary human T cell lysate treated with RNase H and oligos targeting the CDS-UTR junctions. (H) Amount of eIF3-bound mRNA co-immunoprecipitated by the anti-EIF3B antibody, from polysome fractions of primary human T cell lysate treated only with RNase H. In panels C–H, the percentage is relative to the amount of total mRNA present in the polysome fraction prior to immunoprecipitation. All the immunoprecipitation experiments in panels C–H were carried out in biological duplicate with one technical triplicate shown (n = 3, with mean and standard deviations shown). The primary human T cell experiment was done using two donors.


