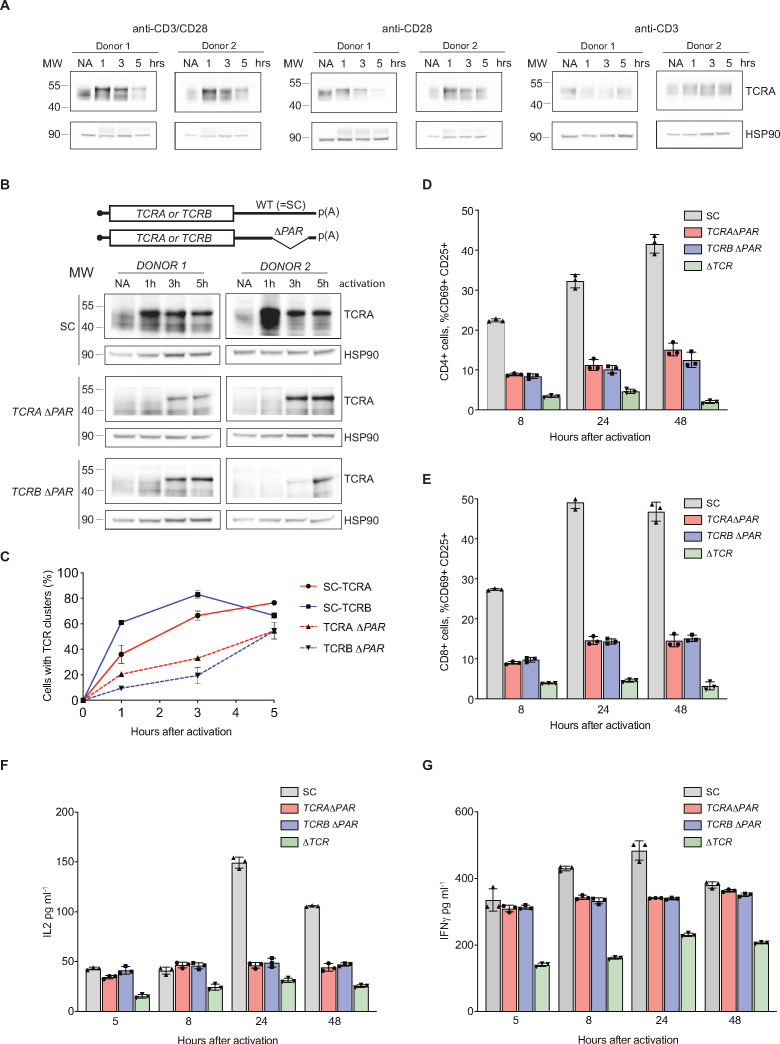
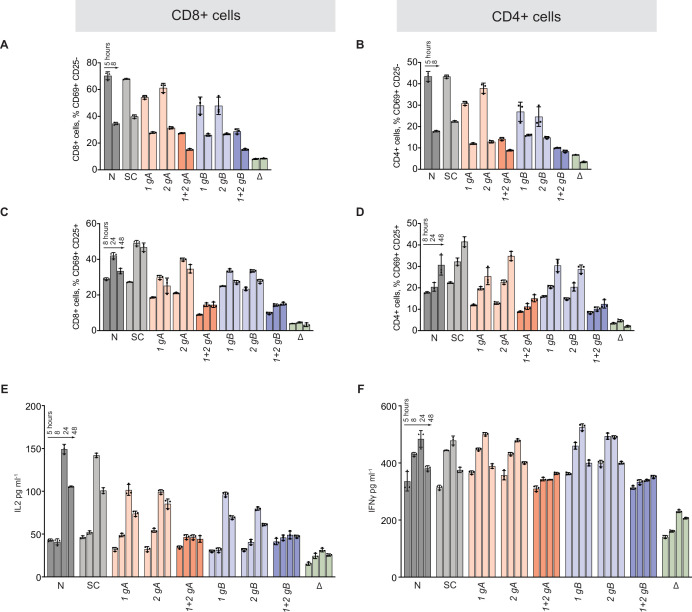
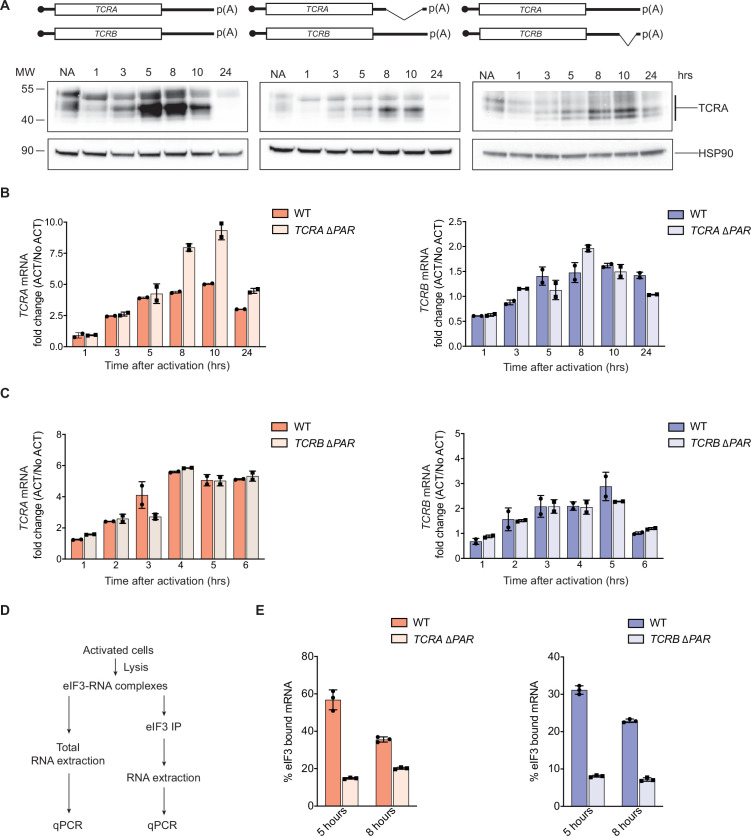
Figure 5. eIF3 binding to the TCRA and TCRB mRNA 3’-UTR elements is required for a rapid burst in TCR translation and robust activation of primary human T cells.
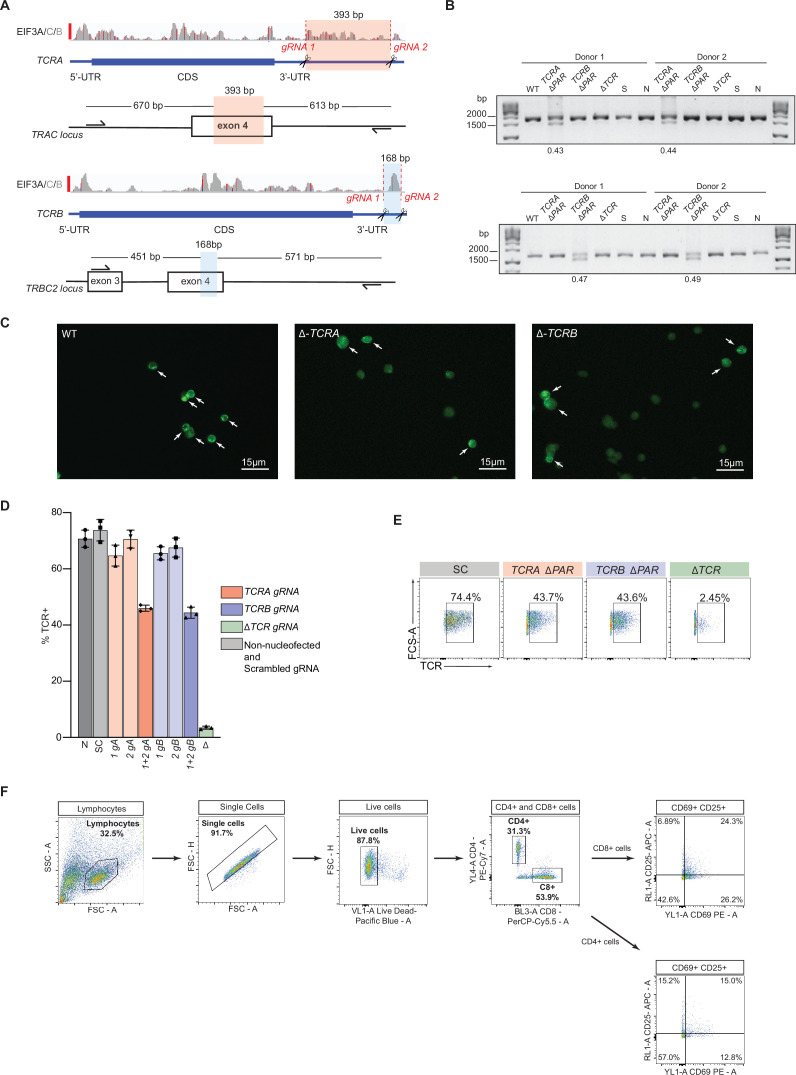
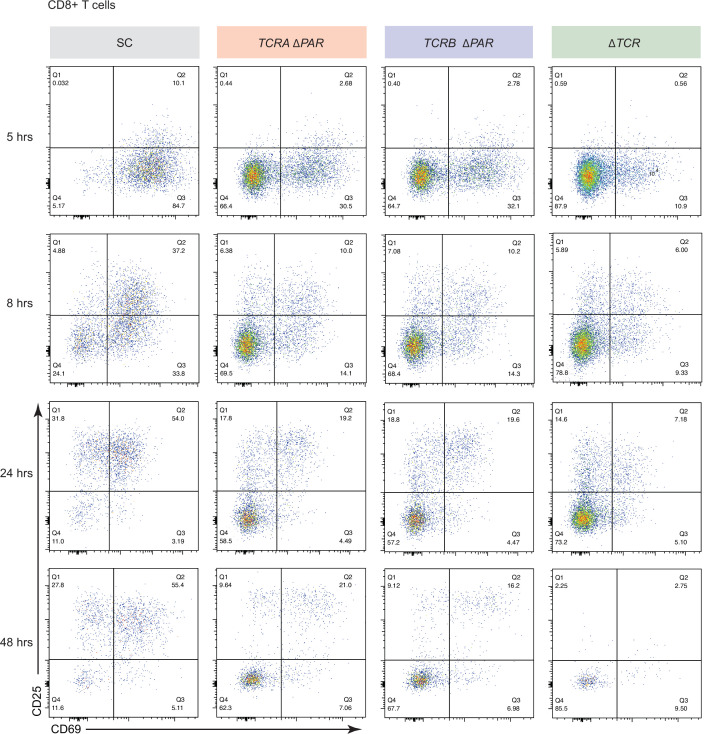
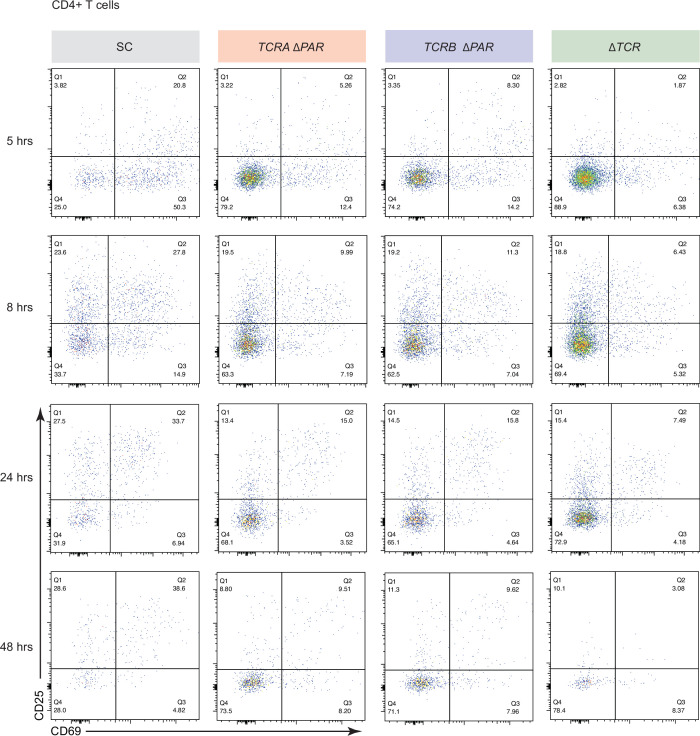
(A) Western blots of TCRA protein levels in T cells as a function of time after different modes of activation. HSP90 was used as a loading control. (B) Western blots measuring TCRA protein levels as a function of time after anti-CD3/anti-CD28 activation. Cell lines used are labeled on the left: TCRA ΔPAR, TCRB ΔPAR, and SC (scrambled gRNA). HSP90 was used as a loading control. Schematics of TCRA and TCRB mRNAs with and without eIF3 PAR-CLIP sites are shown above. SC control cells have the WT 3’-UTRs for TCRA and TCRB mRNAs. (C) The number of T cells with one or more TCR clusters measured by anti-TCRA/anti-TCRB protein staining and epifluorescence microscopy as a function of time after anti-CD3/anti-CD28 activation. A total of 100 cells from each donor were imaged for TCRA ΔPAR (n = 2 donors, stained with anti-TCRA antibody), TCRB ΔPAR (n = 2 donors, stained with anti-TCRB antibody), and SC cell lines (n = 2 donors, each stained separately with anti-TCRA and anti-TCRB antibodies). Values are mean ± standard deviation. (D) Flow cytometric analysis measuring T cell activation markers CD69 (early activation marker) and CD25 (mid-activation marker), quantifying the mean percent of CD4+ T cells that are CD69+ CD25+. (E) Flow cytometric analysis of CD8+ T cells, quantifying the mean percent of CD8+ T cells that are CD69+ CD25+. Cells sorted as shown in Figure 5—figure supplement 2. (F) Quantification of IL2 secreted from SC, TCRA ΔPAR, TCRB ΔPAR, and ΔTCR cell populations at different time points after stimulation with anti-CD3/anti-CD28 antibodies, as determined by ELISA. (G) Quantification IFNγ secreted from the cells in F, as determined by ELISA. In panels D–G, all experiments were carried out in triplicate (three separate wells per condition), with mean and standard deviations shown. Representative results from one donor are shown.

