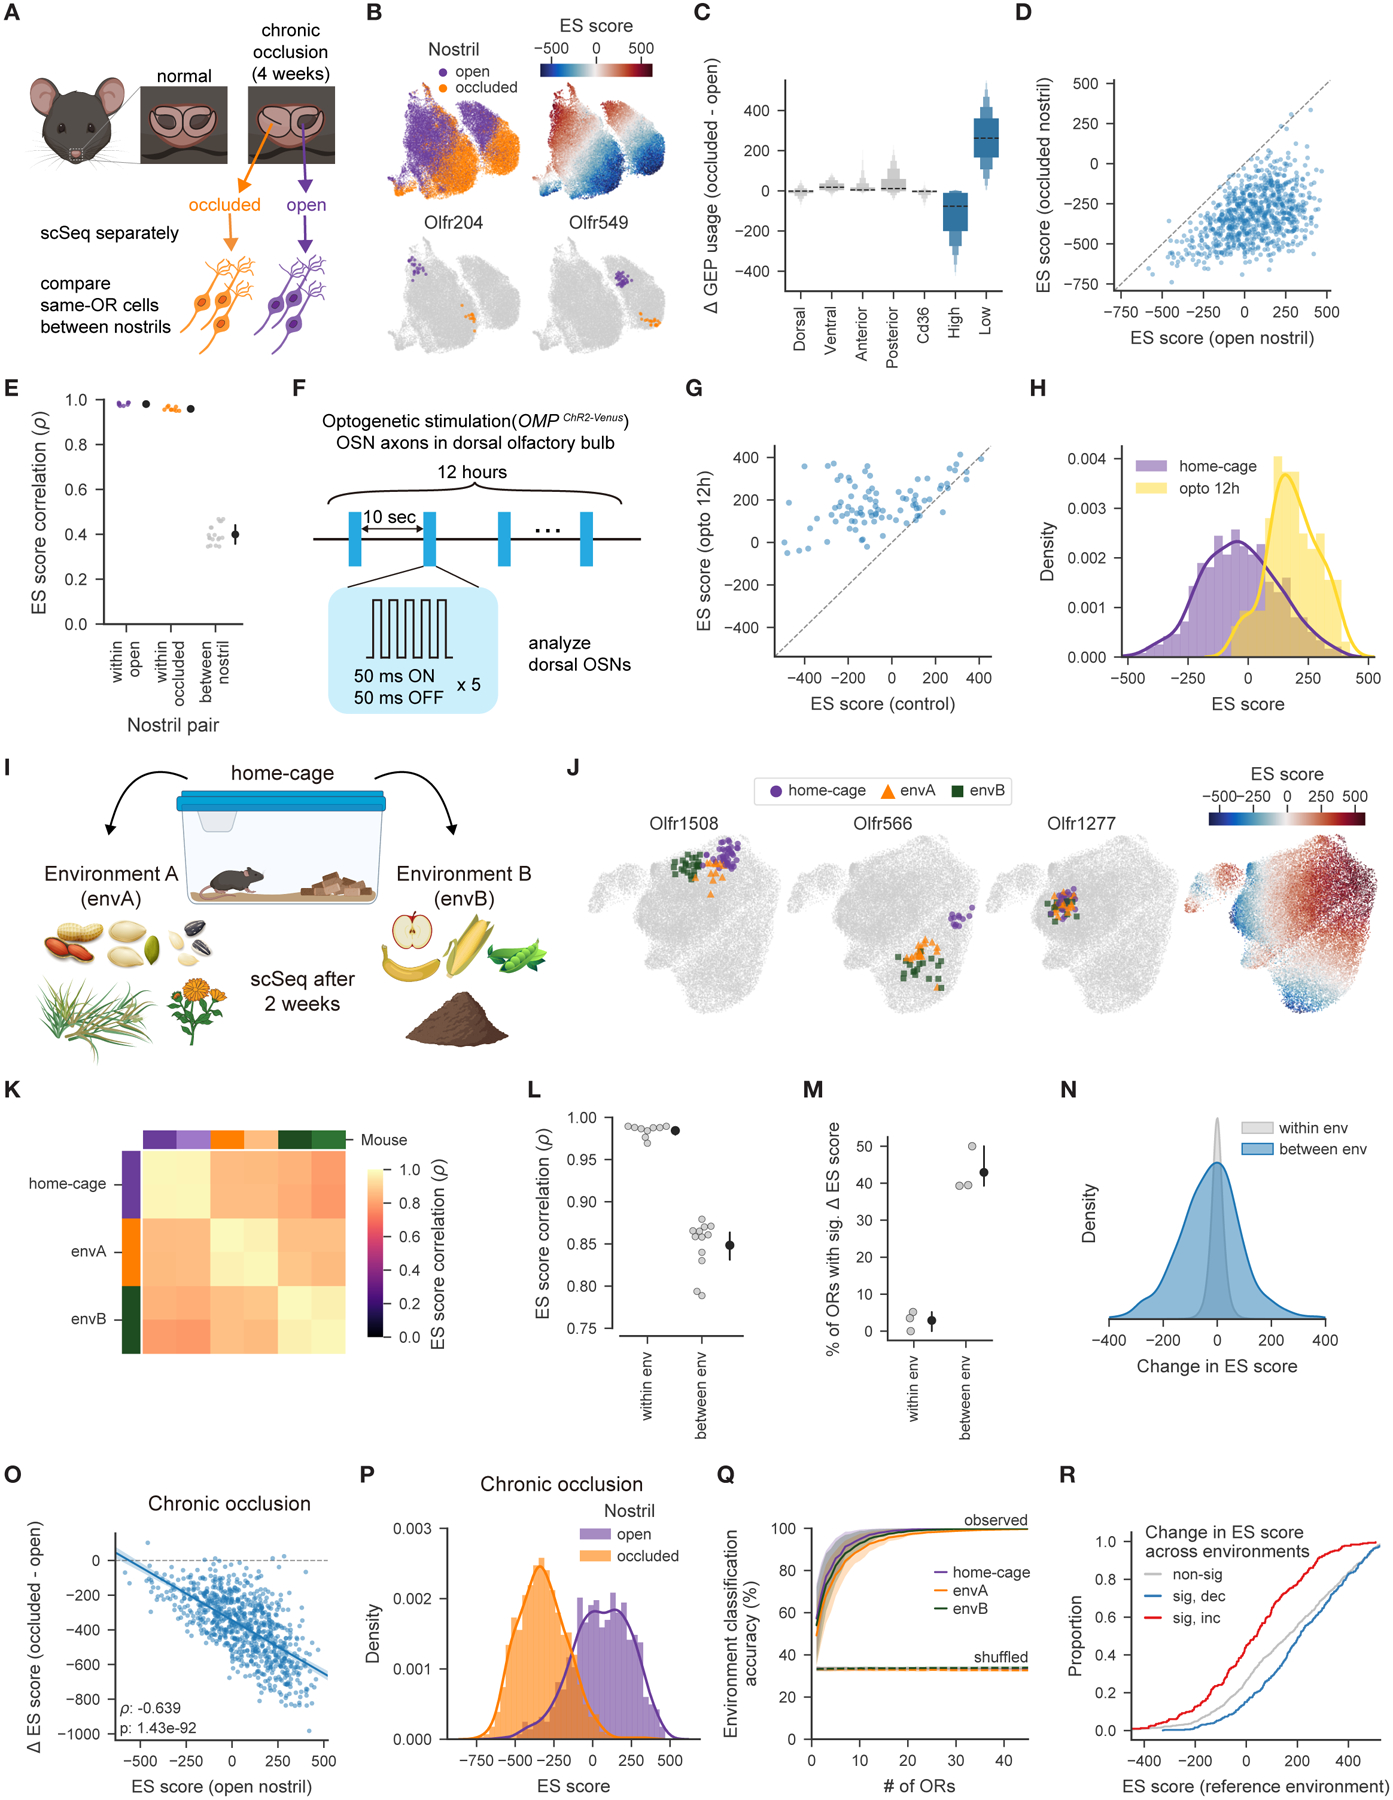
Figure 3. OSN transcriptomes are shaped by the odor environment.

A. Schematic of the chronic naris occlusion experiment.
B. UMAP plots of mature OSNs depicting the nostril of origin, ES scores, and OSNs expressing example ORs.
C. Mean occlusion-dependent changes in GEP usage across OSN subtypes, as defined by OR expression.
D. Mean ES score for each OSN subtype for each nostril. ES scores decreased by occlusion for 770 out of 797 OSN subtypes (FDR ≤ 0.01).
E. Correlation of the mean ES scores for each OSN subtype from the indicated nostril pairs (p=1.68 × 10⁻⁵, Mann-Whitney U test, for both within- vs. between-nostril comparisons).
F. Schematic of the chronic optogenetic stimulation experiment.
G. Mean ES score for each dorsal OSN subtype from stimulated and control (no-light) mice. ES scores increased following optogenetic stimulation for 56 out of 90 subtypes (FDR ≤ 0.01).
H. Distribution of mean ES scores across OSN subtypes from each condition. ES scores following optogenetic stimulation are right-shifted (p=1.33 × 10⁻³⁴, KS-test).
I. Schematic of the environment switch experiment.
J. UMAP plots highlighting (left) OSNs expressing example ORs from mice housed in each of the three environments. (right) OSN ES scores.
K. Pairwise correlations of the mean ES scores for each OSN subtype, across mice from the indicated environments.
L. Pairwise correlations from K. separated by the type of comparison. Correlations are higher for mice housed within the same environment (p=7.17 × 10⁻⁷, Mann-Whitney U test).
M. Percent of OSN subtypes whose ES scores change significantly (FDR ≤ 0.01), for animals from the same or different environments.
N. Distribution of ES score changes, for OSN subtypes from the same or different environments. ES score changes are larger between environments (p=5.16 × 10−140, KS-test).
O. The observed occlusion-induced change in ES scores for each OSN subtype, as a function of ES scores from open nostrils.
P. Distribution of the mean ES scores across OSN subtypes from each nostril. ES scores following occlusion are left-shifted (p=3.74 × 10−217, KS-test).
Q. Accuracy of a minimum distance classification procedure (see Methods) to predict in which environment a mouse was housed, based upon ES scores for each OSN subtype (observed or shuffled environment as labeled, curves depict the mean and interquartile range of classification accuracy for each environment across 1000 restarts).
R. Cumulative distribution of ES scores in a given reference environment for OSN subtypes whose ES scores were significantly increased, decreased, or unchanged across environments. Those OSNs whose ES scores decreased tended to have higher ES scores in the reference environment (p=4.03 × 10⁻⁸, KS-test); the opposite was true for those OSNs whose scores increased (p=2.32 × 10⁻¹⁴).
See also Figure S3.
