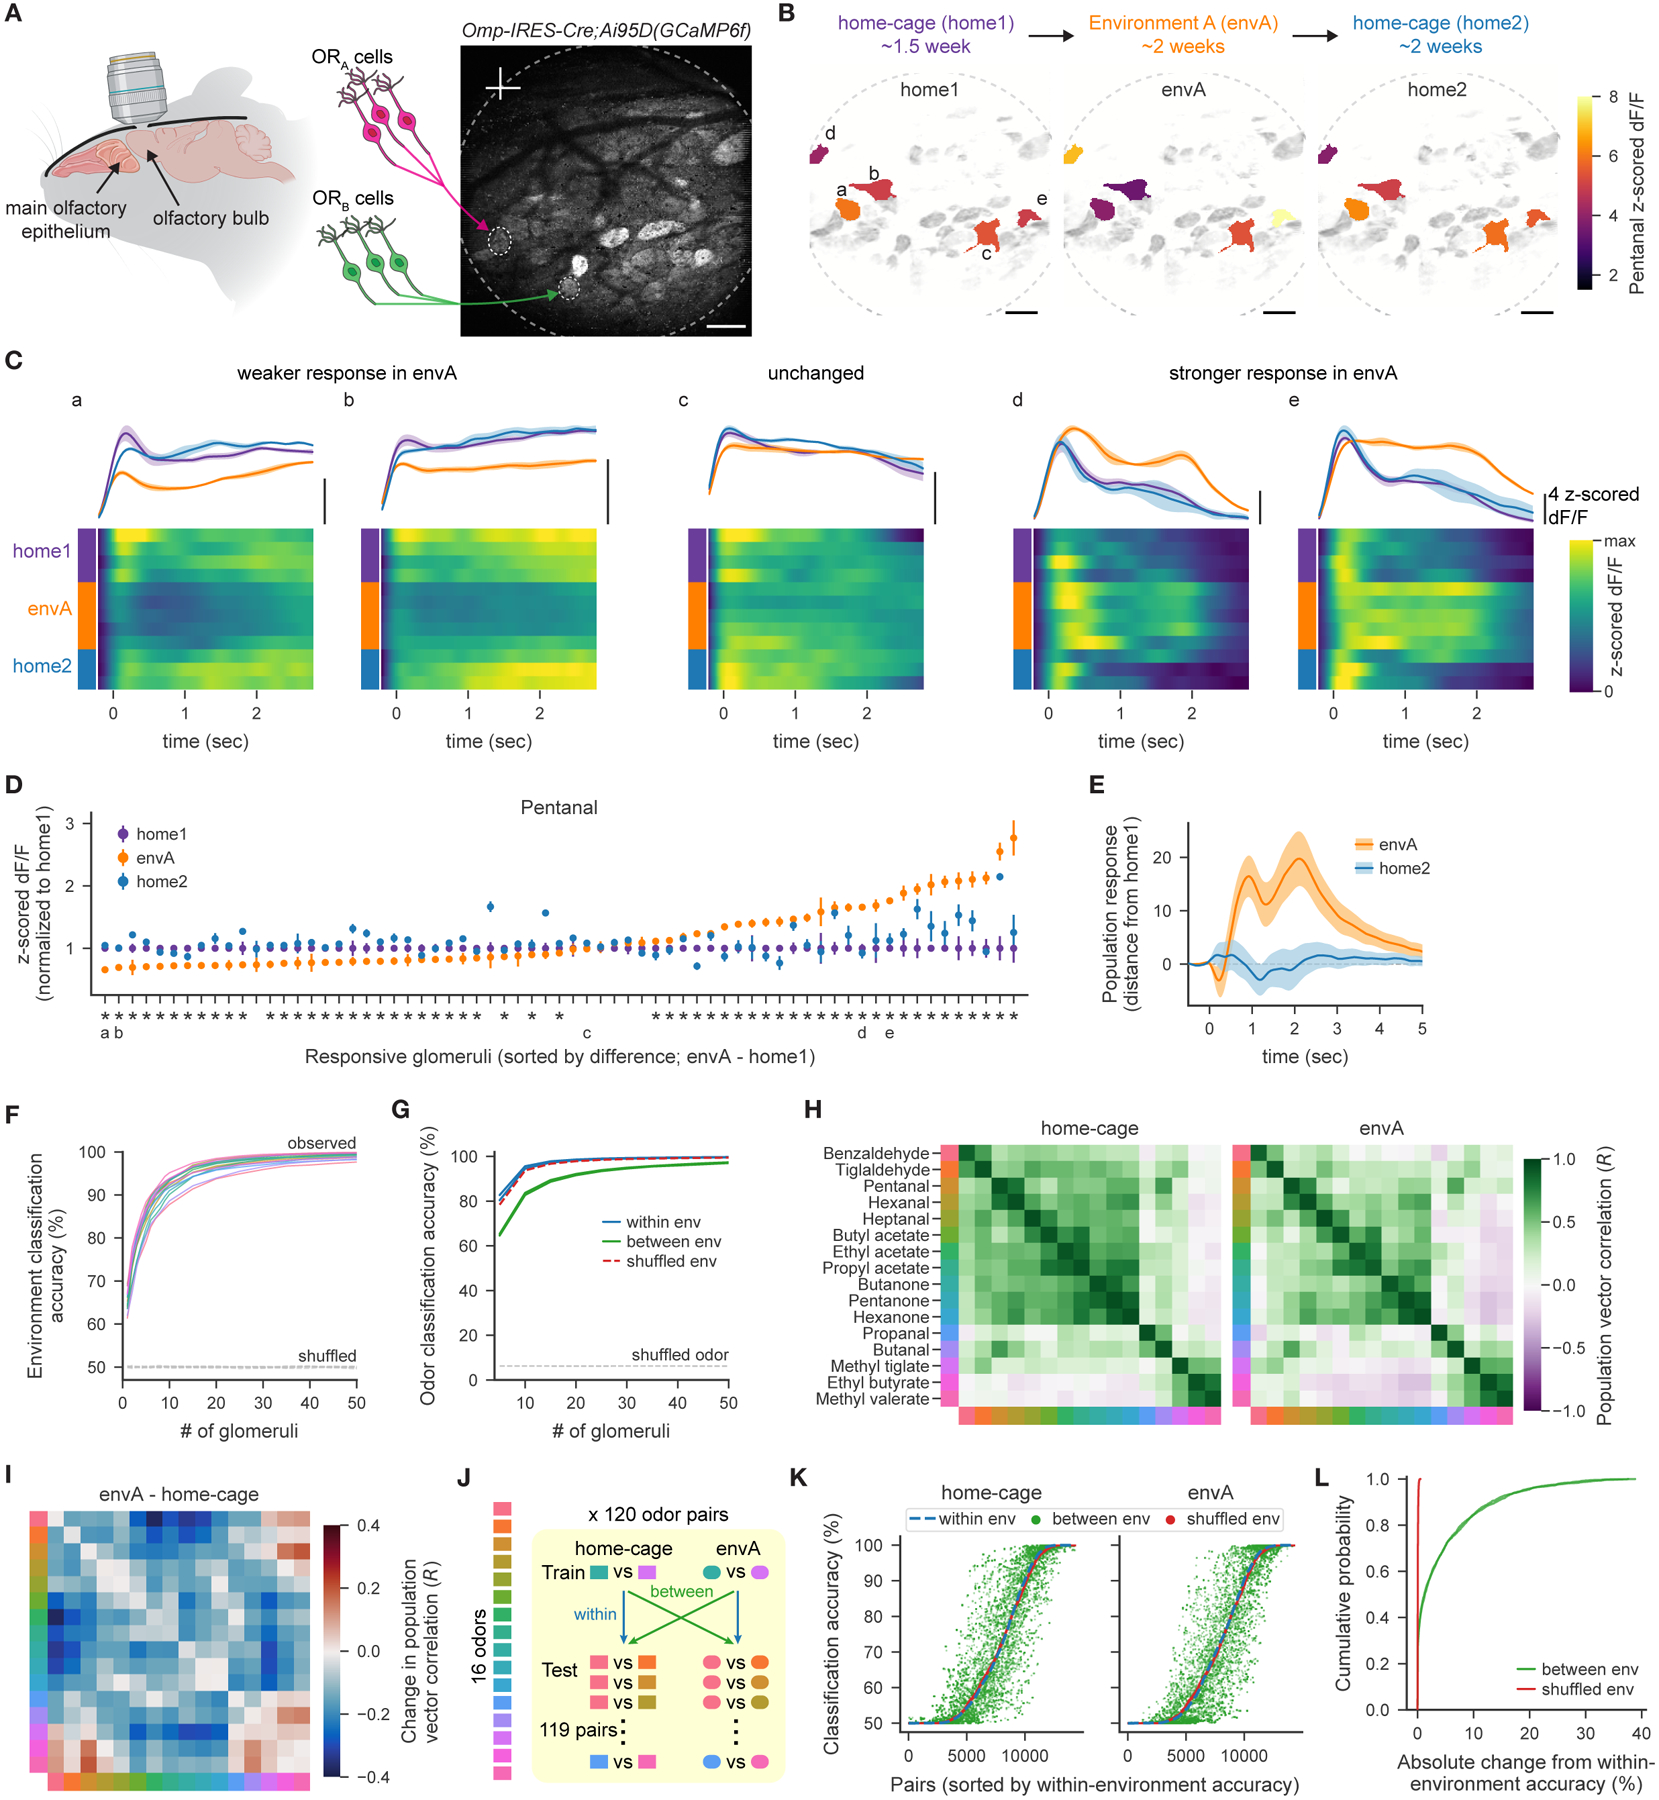
Figure 7. The ambient odor environment determines functional odor responses.

A. Schematic of the olfactory bulb imaging experiment. Scale bar = 200 μm. Data shown in A.-D. are from mouse 1 (see Fig. S7B).
B. Mean z-scored dF/F responses to pentanal for example glomeruli and the mean fluorescence image (in gray) for each environment. Data from glomeruli marked a-e are depicted in C. and D. Scale bars = 200 μm.
C. Z-scored dF/F responses for example glomeruli. Heatmaps depict average across trials within each session, and the mean ± SEM across sessions for each environment are shown above.
D. Glomerular responses to pentanal for each environment (mean ± SEM across sessions), normalized to the home-cage (home1) response, for pentanal-responsive glomeruli. Asterisks indicate glomeruli whose responses in environment A (envA) differ from those of home1 (FDR ≤ 0.01, permutation test).
E. Distance between the population response to pentanal in home1 and the response in either envA or home2, as a function of time (see Methods). Shaded error bars depict the mean and SD across 1000 restarts.
F. Accuracy of pairwise linear classifiers predicting in which environment (home-cage or envA) a mouse was housed from the mean odor responses of increasing populations of glomeruli for each odor (as colored in H.).
G. Accuracy of linear classifiers predicting odor identity from mean glomerular responses, to each of 16 odors, using increasing populations of glomeruli. Classification in which training and test data are from either the same or different environments, and from data with shuffled environment labels, are shown separately.
H. Correlation matrix summarizing pairwise relationships between mean odor responses across the population of glomeruli from mouse 5 (see Fig. S7B).
I. The difference between the correlation matrices shown in H.
J. Procedure for evaluating changes in odor codes across environments, by assessing how well a given pairwise odor classifier generalizes, across all other odor pairs, to test data from the same or different environments.
K. Classification accuracy for each of the test × train pairs (120 × 119 pairs), sorted by the accuracy when training and test data are from the same environment (within-environment). Colors depict whether training and test data are either from same or different environments, or from data with shuffled environment labels.
L. Summary of K. showing the cumulative fraction of the absolute change in generalization accuracy, relative to within-environment accuracy.
See also Figure S7.
