
Fig. 1. SCs stabilize injured axons.
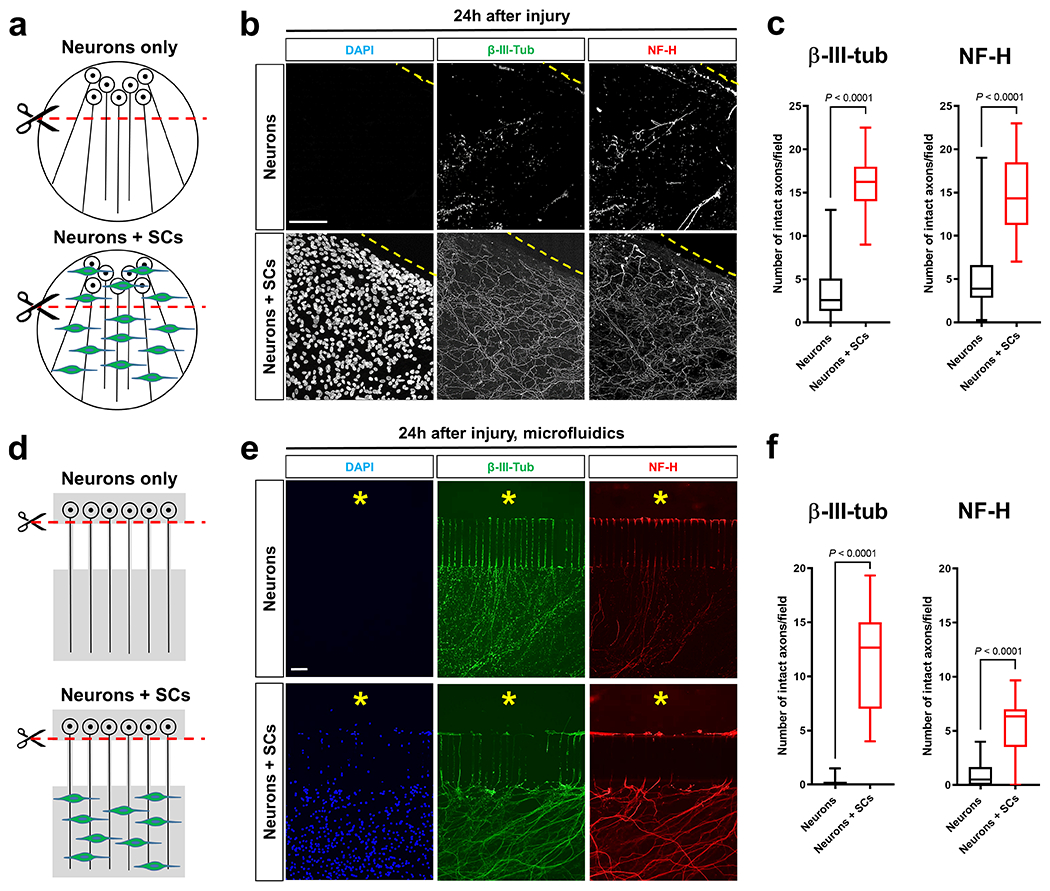
a, d, Schematics of the in vitro axon injury models. b, e, Representative micrographs show immunolabeled axons 24h after disconnection from the neuronal cell bodies under the indicated conditions. Dotted lines in conventional cultures indicate axotomy sites. Asterisks in microfluid cultures indicate aspirated neuronal cell body area. DAPI signal depicts SC nuclei. Scale bars: 100μm The experiment was reproduced four times independently with similar results in conventional cultures and three times with similar results in microfluidic cultures. c, Box and whiskers plots (maximum, 25th percentile, median, 75th percentile, minimum) of axon survival in conventional cultures 24h following injury (β-III-tub, Neurons: n=73 DRG neurite preparations; β-III-tub, Neurons+SCs: n=57 DRG neurite preparations; NF-H, Neurons: n=77 DRG neurite preparations; NF-H Neurons+SCs: n=57 DRG neurite preparations; all DRG neurite preparations from four experimental sets performed on different days). f, Box and whiskers plots (maximum, 25th percentile, median, 75th percentile, minimum) of axon survival in microfluidic device cultures 24h following injury (βIII-tub, Neurons: n=23 DRG neurite preparations; β-III-tub, Neurons+SCs: n=23 DRG neurite preparations; NF-H, Neurons: n=22 DRG neurite preparations; NF-H, Neurons+SCs: n=23 DRG neurite preparations; all DRG neurite preparations from three experimental sets performed on different days).
Statistical evaluation in c and f was performed using Student’s t-test, unpaired, two-tailed.