
Extended Data Fig. 6. Upregulation of AMPK activity in injury-activated SCs, and analysis of nerves from conditional mutant mice lacking AMPK or mTOR activity in SCs.
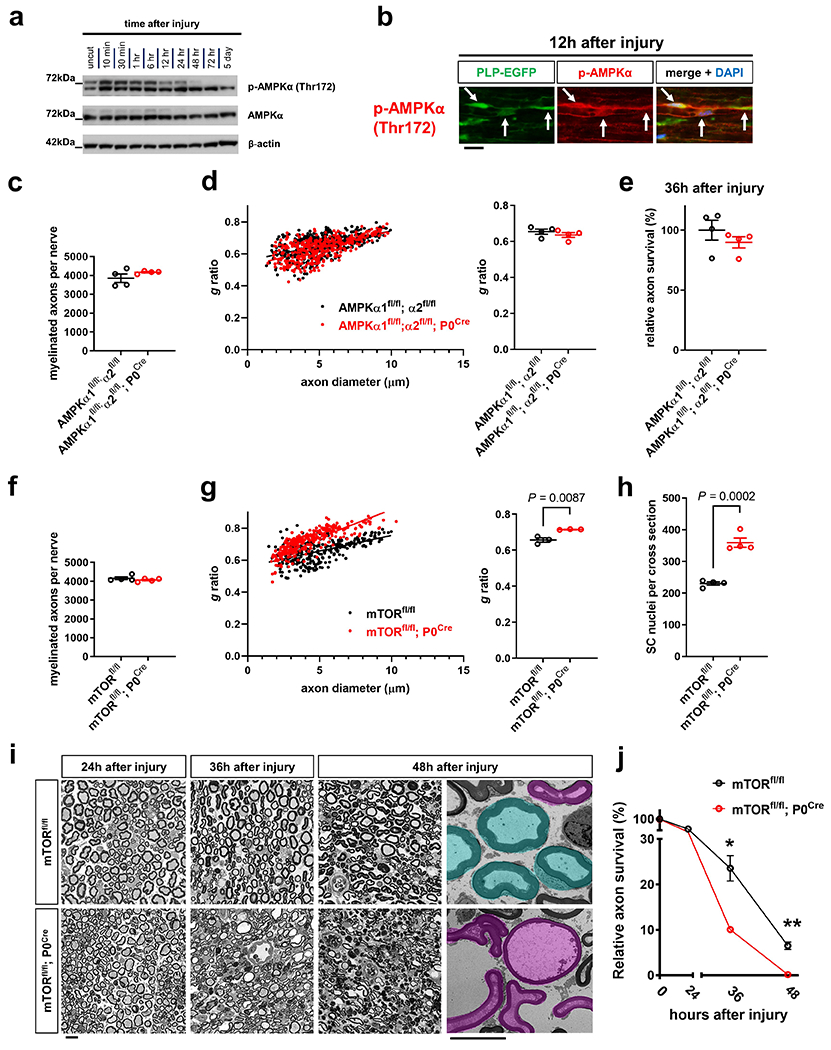
a, Western blot analysis (cropped blot images) of lysates from uninjured control nerve segments and axotomized distal sciatic nerve stumps from C57Bl/6J mice showing AMPK activity at different times following nerve transection. Note marked AMPK activation as reflected by increased p-AMPKα phosphorylation at Thr172 already 10 min after nerve injury. Individual lanes represent pooled data from at least three mice. b, Representative immunofluorescence for p-AMPKα (Thr172) on longitudinal frozen section from axotomized distal sciatic nerve stump 12h after nerve injury. Arrows depict colocalization in SCs. Scale bar: 20μm. The experiment was reproduced three times independently with similar results. c, f, Quantification of myelinated axons in sciatic nerves from indicated 8-weeks-old control and mutant mice (Error bars represent s.e.m. n=4 mice per genotype for each graph). d, g, Quantification of g ratios (left: scatter plots show g ratios of individual myelinated axons as function of axon diameter, right: corresponding cumulative g ratios per animal) in sciatic nerves from indicated 8-weeks-old control and mutant mice (Error bars represent s.e.m. n=4 mice per genotype for d and n=3 mice per genotype for g). e, Quantitative analysis of relative axon survival in distal sciatic nerve stumps 36h after axotomy in mice with the indicated genotypes (Error bars represent s.e.m. n=4 mice per genotype). h, Quantification of SC nuclei in sciatic nerve cross sections in 8-weeks-old mice with the indicated genotypes (Error bars represent s.e.m. n=4 mice per genotype). i-j, Representative semithin and electron micrographs (last panel with pseudocoloring) of transverse sciatic nerve sections of distal nerve stumps from mice with the indicated genotypes at different time points after sciatic nerve transection (i) with corresponding quantifications of relative axon survival (j). Electron micrographs show pseudocoloring of intact (turquoise) and degenerated (magenta) myelinated fibers. Note accelerated AxD in the mTORfl/fl; P0Cre mutants (Error bars represent s.e.m. n=3 mice for mTORfl/fl for 0 and 36 hours after axotomy, n=4 mice for mTORfl/fl for 24 and 48 hours after axotomy, n=3 mice for mTORfl/fl; P0Cre for 0 hours after axotomy, n=4 mice for mTORfl/fl; P0Cre for 24 and 36 hours after axotomy, n=6 mice for mTORfl/fl; P0Cre for 48 hours after axotomy, *P=0.003, ** P<0.0001). Scale bars: 10μm.
Statistical evaluation in c-h was performed using Student’s t-test, unpaired, two-tailed, and in j using multiple Student’s t-test, unpaired, two-tailed.