
Extended Data Fig. 7. Analysis of nerves from mutant mice lacking key mTOR components in SCs.
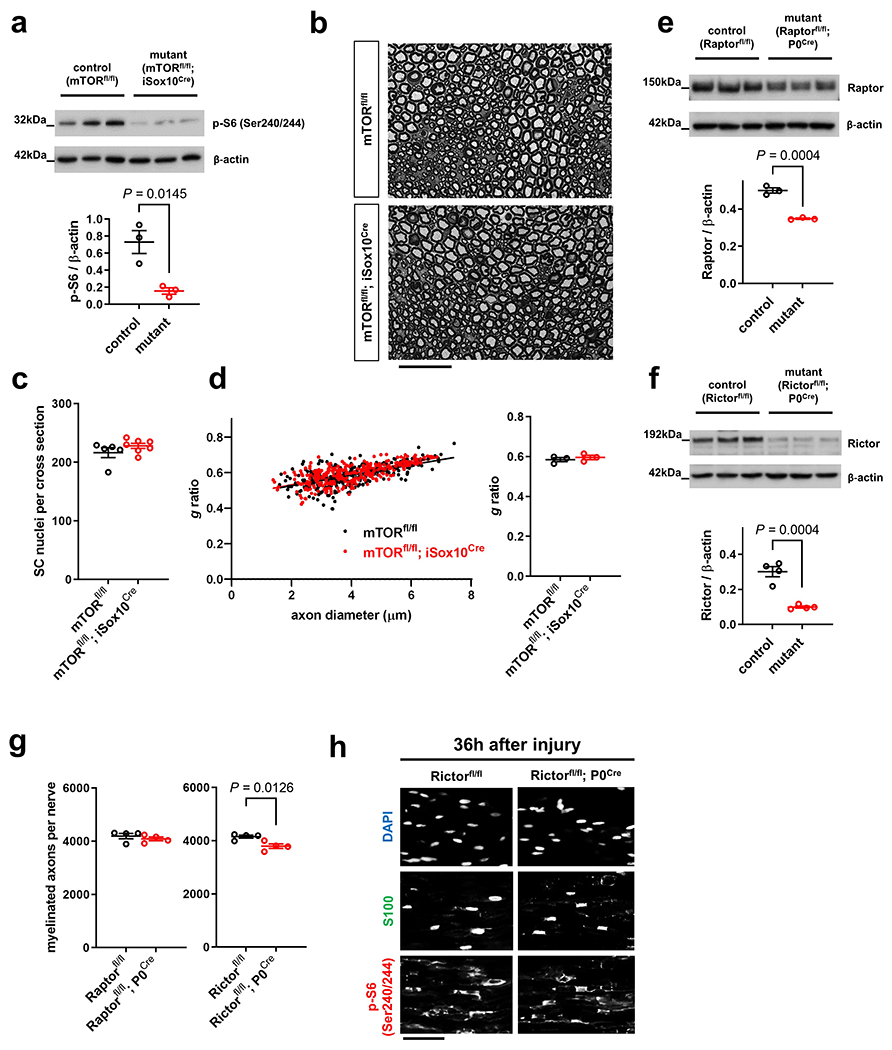
a, Western blot mTORC1 activity (reflected by S6 phosphorylation at Ser240/244) analysis of sciatic nerve lysates (cropped blot images) from control and mTORfl/fl; iSox10Cre mice (30 days after last tamoxifen administration) probed with the indicated antibodies (Error bars represent s.e.m. n=3 mice per genotype. Each dot represents measurement from sciatic nerve lysate from one mouse). b, Representative semithin micrographs of transverse sciatic nerve sections from 12-weeks-old control and mTORfl/fl; iSox10Cre mice 30 days following last tamoxifen administration. Note indistinguishable nerve structure between control and mutant mice. Scale bar: 50μm. c, Quantification of SC nuclei in sciatic nerve cross sections from mice with the indicated genotypes 30 days following tamoxifen administration (Error bars represent s.e.m. n=5 mice for mTORfl/fl and n=7 mice for mTORfl/fl; iSox10Cre). d, Quantification of g ratios (left: scatter plots show g ratios of individual myelinated axons as function of axon diameter, right: corresponding cumulative g ratios per animal) in sciatic nerves from mice with the indicated genotypes 30 days following tamoxifen administration (Error bars represent s.e.m. n=3 mice per genotype). e, f, Western blot analysis (cropped blot images) of sciatic nerve lysates from indicated control and mutant mice (age 5 days in e and 8 weeks in f) probed with the shown antibodies (Error bars represent s.e.m. n=3 mice per genotype in e and n=4 mice per genotype in f. Each dot represents measurement from sciatic nerve lysate from one mouse). g, Quantification of myelinated axons in sciatic nerves from indicated 8-weeks-old control and mutant mice (Error bars represent s.e.m. n=4 mice per genotype for each graph). h, Representative immunofluorescence using the indicated markers on longitudinal frozen sections of distal sciatic nerve stumps from control and Rictorfl/fl; P0Cre mutant mice 36h after nerve transection injury. Note normal induction of mTORC1 activity in SCs of Rictor-deficient mice as reflected by indistinguishable p-S6 (Ser240/244) immunoreactivity. Scale bar: 50μm. The experiment was reproduced three times independently with similar results.
Statistical evaluation in a, c-g was performed using Student’s t-test, unpaired, two-tailed.