
Extended Data Fig. 8. Nerves from mutant mice with depletion of c-Myc and/or Hif1α in SCs show no abnormalities of myelinated axons.
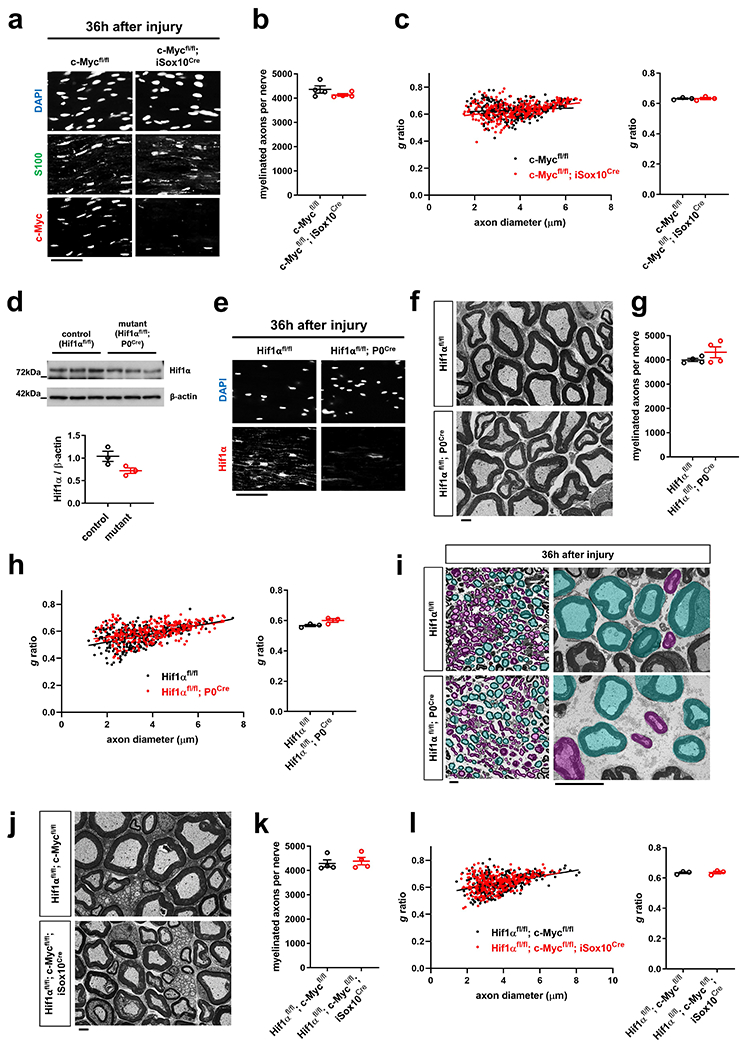
a, Representative immunofluorescence using the indicated antibodies on longitudinal sections of axotomized sciatic nerve stumps from control and c-Mycfl/fl; iSox10Cre mutant mice (30 days after last tamoxifen administration) 36h after nerve transection injury. Note largely abolished induction of c-Myc expression in SCs (S100+) of c-Mycfl/fl; iSox10Cre mice. Scale bar: 50μm. The experiment was reproduced three times independently with similar results. b, Quantification of myelinated axons in sciatic nerves from 12-weeks-old mice with the indicated genotypes 30 days following tamoxifen administration (Error bars represent s.e.m. n=4 mice per genotype). c, Quantification of g ratios (left: scatter plots show g ratios of individual myelinated axons as function of axon diameter, right: corresponding cumulative g ratios per animal) in sciatic nerves from 12-weeks-old mice with the indicated genotypes 30 days following tamoxifen administration (Error bars represent s.e.m. n=3 mice per genotype). d, Western blot analysis (cropped blot images) of sciatic nerve lysates from 8-weeks-old mice with the indicated genotypes probed with the shown antibodies (Error bars represent s.e.m. n=3 mice per genotype for each graph. Each dot represents measurement from sciatic nerve lysate from one mouse). e, Representative immunofluorescence using the indicated markers on longitudinal frozen sections of axotomized sciatic nerve stumps from control and Hif1αfl/fl; P0Cre mutant mice 36h after nerve transection injury. Note largely abolished induction of Hif1α expression in Hif1αfl/fl; P0Cre mice. Scale bar: 50μm. The experiment was reproduced three times independently with similar results. f, Representative electron micrographs of transverse sciatic nerve sections from 8-weeks-old control and Hif1αfl/fl; P0Cre mice. Note indistinguishable nerve ultrastructure between control and mutant mice. Scale bar: 2μm. g, Quantification of myelinated axons in sciatic nerves from 8-weeks-old mice with the indicated genotypes (Error bars represent s.e.m. n=4 mice per genotype for each graph). h, Quantification of g ratios (left: scatter plots show g ratios of individual myelinated axons as function of axon diameter, right: corresponding cumulative g ratios per animal) in sciatic nerves from 8-weeks-old mice with the indicated genotypes (Error bars represent s.e.m. n=3 mice per genotype). i, Representative semithin (left) and electron micrographs (right) of transverse sciatic nerve sections from distal nerve stumps of mice with the indicated genotypes 36h after sciatic nerve transection with pseudocoloring of intact (turquoise) and degenerated (magenta) myelinated fibers. Scale bars: 10μm. The experiment was reproduced three times independently with similar results. j, Representative electron micrographs of transverse sciatic nerve sections from 12-weeks-old control and Hif1αfl/fl; c-Myc fl/fl; iSox10Cre mice 30 days following the last tamoxifen administration. Note indistinguishable nerve ultrastructure between control and mutant mice. Scale bar: 2μm. k, Quantification of myelinated axons in sciatic nerves from 12-weeks-old mice with the indicated genotypes 30 days following tamoxifen administration (Error bars represent s.e.m. n=4 mice per genotype). l, Quantification of g ratios (left: scatter plots show g ratios of individual myelinated axons as function of axon diameter, right: corresponding cumulative g ratios per animal) in sciatic nerves from 12-weeks-old mice with the indicated genotypes 30 days following tamoxifen administration (Error bars represent s.e.m. n=3 mice per genotype).
Statistical evaluation in b-d, g, h, k, l was performed using Student’s t-test, unpaired, two-tailed.