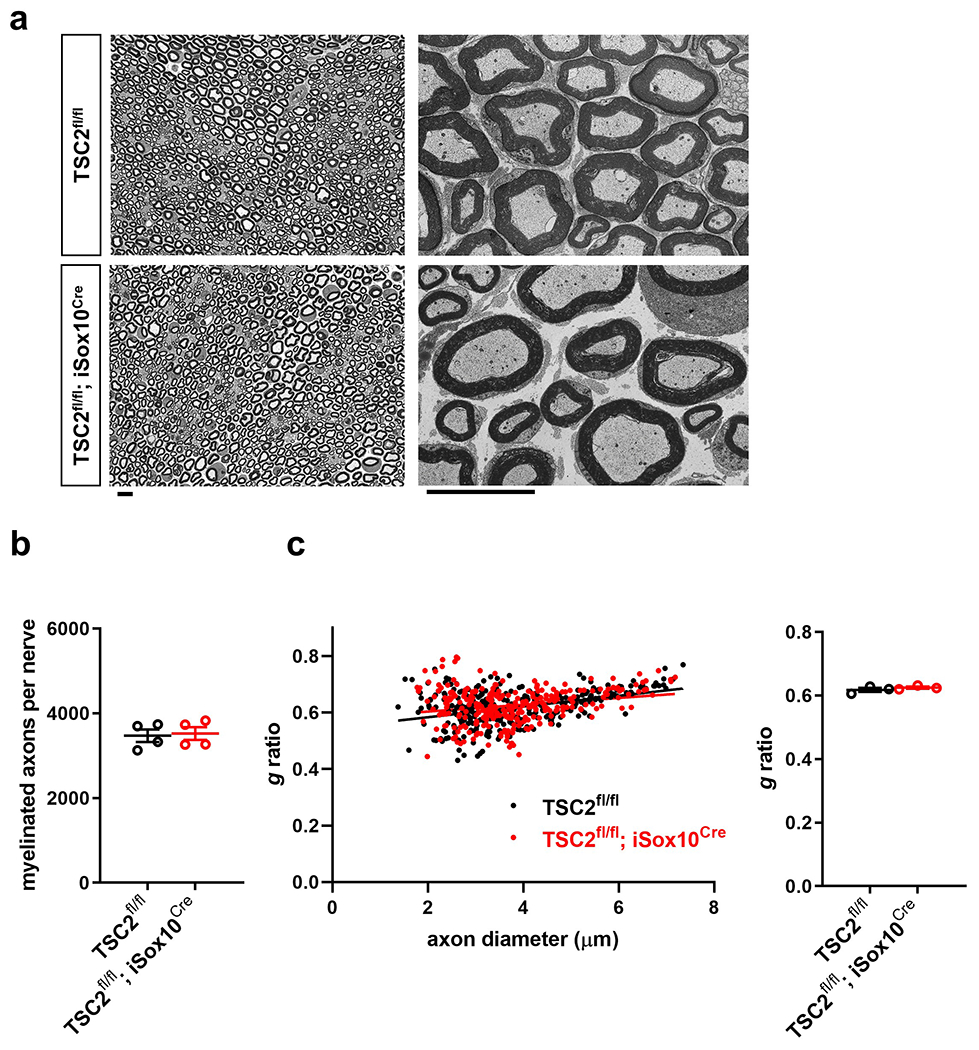
Extended Data Fig. 9. Nerves from mutant mice with depletion of TSC2 in SCs show no abnormalities of myelinated axons.

a, Representative semithin (left) and electron micrographs (right) of transverse sciatic nerve sections from 12-weeks-old control and TSC2fl/fl; iSox10Cre mice 30 days following tamoxifen administration. Scale bars: 10μm. b, Quantification of myelinated axons in sciatic nerves from mice with the indicated genotypes 30 days following tamoxifen administration (Error bars represent s.e.m. n=4 mice per genotype). c, Quantification of g ratios (left: scatter plots show g ratios of individual myelinated axons as function of axon diameter, right: corresponding cumulative g ratios per animal) in sciatic nerves from mice with the indicated genotypes 30 days following tamoxifen administration (Error bars represent s.e.m. n=3 mice per genotype).
Statistical evaluation in b and c was performed using Student’s t-test, unpaired, two-tailed.
