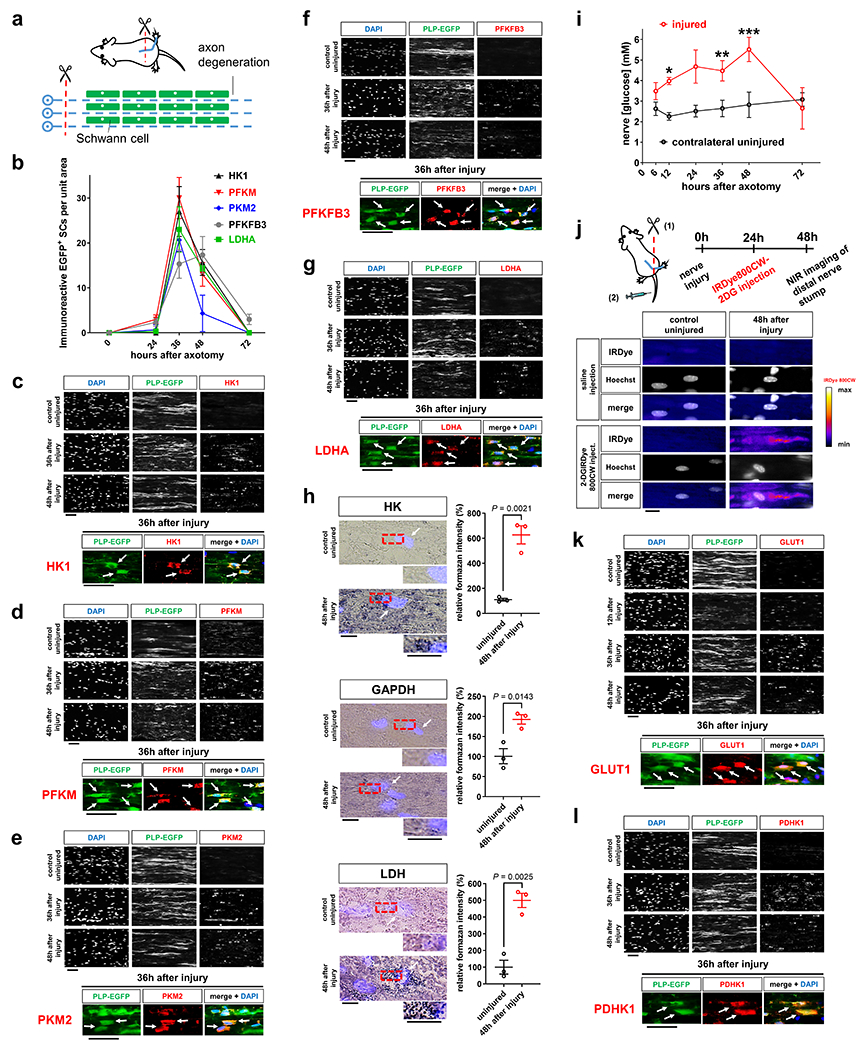
Fig. 2. Glycolytic upregulation in SCs upon axon injury.

a, Schematic representation of Wallerian degeneration after unilateral sciatic nerve transection in mice. b, Quantification of EGFP+ SCs immunoreactive for the indicated markers after axotomy in distal nerve stumps at indicated post-injury times (Error bars represent s.e.m. n=3 mice per time point for each marker). c-g, k, l, Representative immunofluorescence for the indicated components on longitudinal frozen sections from uninjured control nerve segments and distal sciatic nerve stumps at the shown post-injury times. Arrows depict co-localization. HK1: hexokinase. PFKM: phosphofructokinase M. PKM2: Pyruvate kinase M2. Scale bars: 50μm. The experiments were reproduced three times independently with similar results. h, Left: Representative images of longitudinal sciatic nerve sections stained for the activity of HK, GAPDH, and LDH (formazan formation) under the indicated conditions with superimposition of DAPI signals (arrows) indicating position of cell nuclei. Scale bars: 10μm. Right: Densitometric quantification of formazan intensity representing respective enzyme activities on nerve sections (Error bars represent s.e.m. n=3 mice for each graph). i, Glucose concentrations in lysates of sciatic nerve segments (Error bars represent s.e.m. n=3 mice per condition for 6, 12, 24, 36, and 72 hours after axotomy, n=4 mice per condition for 48 hours after axotomy, *P=0.0025, **P=0.0448, ***P=0.0199). j, Top: Schematic showing experimental time course to image glucose tracer uptake in axotomized nerves. Bottom: Representative intensity micrographs for IRDye800CW-2DG uptake under the indicated conditions. Note markedly elevated cellular glucose tracer uptake following nerve injury. Scale bar: 10μm. The experiment was reproduced three times independently with similar results.
Statistical evaluation in h was performed using Student’s t-test, unpaired, two-tailed, and in i using multiple Student’s t-test, unpaired, two-tailed.
