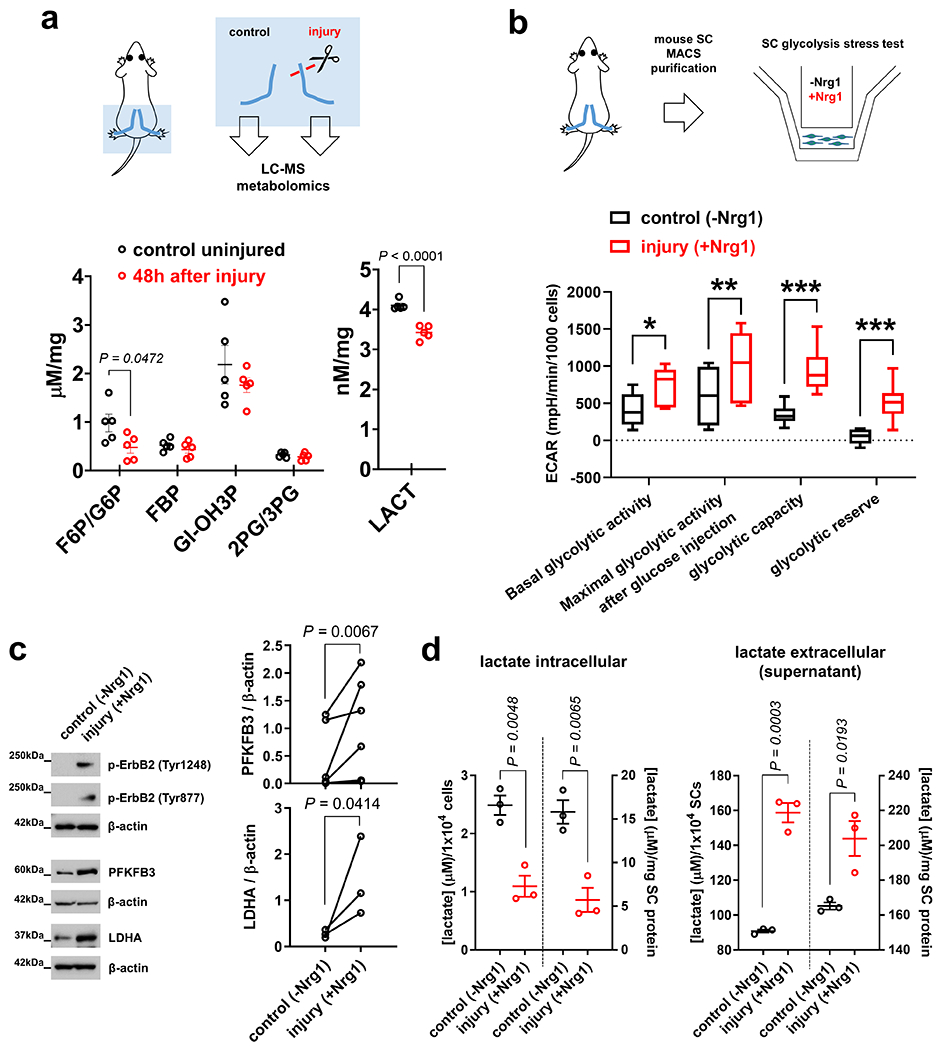
Fig. 3. Enhanced glycolytic flux and lactate extrusion in injury-activated SCs.

a, Top: Scheme of metabolomic analysis using extracts from nerve segments. Bottom: Concentrations of key energy metabolism intermediates in control and axotomized nerve segments from C57Bl/6J mice (F6P/G6P: fructose-6-phosphate/glucose-6-phosphate. FBP: fructose-1,6-bisphosphate. GI-OH3P: Glyceraldehyde-3-phosphate. 2PG/3PG: 2-phosphoglycerate/3-phosphoglycerate. LACT: lactate) (Error bars represent s.e.m. n=5 mice per condition and metabolite). b, Top: Scheme of extracellular flux analysis of SCs purified from C57Bl/6J mouse nerves. Bottom: Box and whiskers plot (maximum, 25th percentile, median, 75th percentile, minimum) shows glycolytic activity parameters as assessed by extracellular acidification rate (ECAR) measurements in control mouse SCs and cells with Nrg1-induced ErbB2 activation (n=9 well preparations per condition, *P=0.0080, **P=0.0464, ***P<0.0001). c, Western blot analysis (cropped blot images) of control- and Nrg1-treated C57Bl/6J mouse SCs probed with the indicated antibodies. (n=6 independent pair preparations (2 separate dishes) for PFKFB3, and n=3 independent pair preparations (2 separate dishes) for LDHA quantification). d, Intracellular and extracellular (supernatant) lactate concentrations from control and Nrg1-treated mouse SC preparations normalized to cell number and cellular protein. Note decreased intracellular and increased extracellular lactate levels in SCs treated with Nrg1 for 24h, indicating greatly increased lactate extrusion (Error bars represent s.e.m. n=3 well preparations from 3 independent experiments per condition).
Statistical evaluation in a, b, d was performed using Student’s t-test, unpaired, two-tailed, and in c using Ratio Paired t-test, one-tailed.
