
Fig. 7. The mTORC1-Hif1 α/c-Myc axis in SCs protects injured axons.
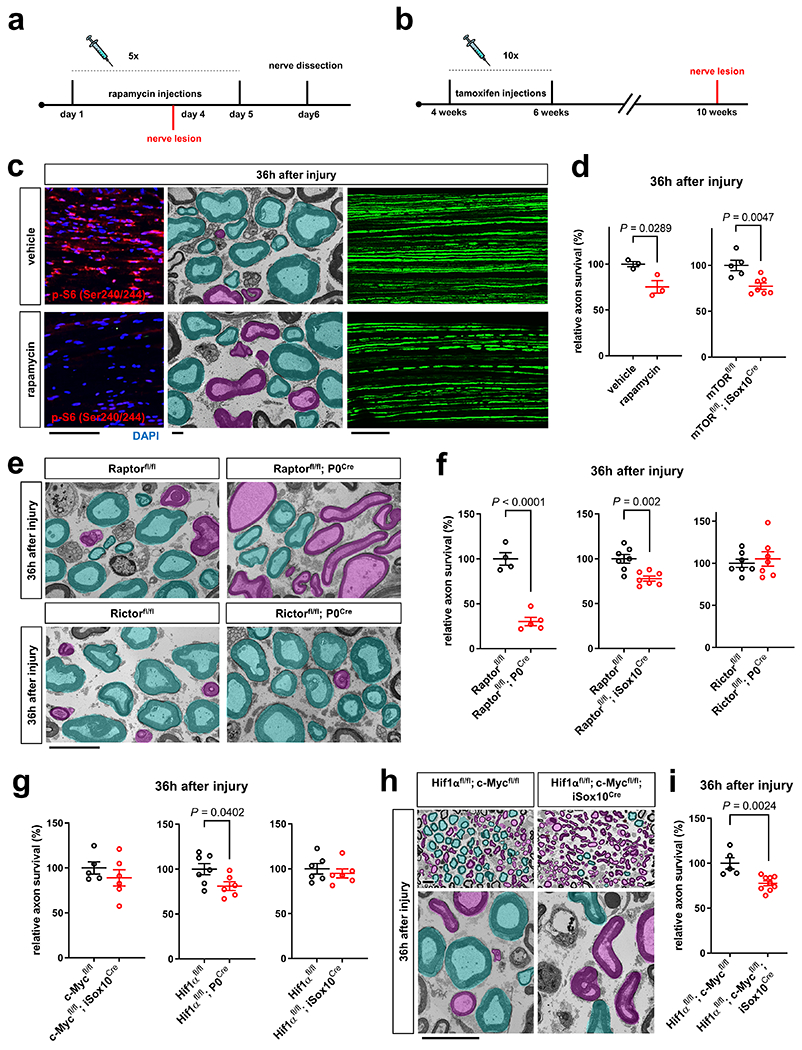
a, b, Experimental paradigm for rapamycin injections in Thy1.2-YFP-H (a) and tamoxifen injections in mTORfl/fl; iSox10Cre mice (b). c, Left: Representative p-S6 (Ser240/244) immunofluorescence reflecting mTORC1 activity on longitudinal distal sciatic nerve stump frozen sections from vehicle and rapamycin treated mice 36h after axotomy. Scale bar: 100μm. Middle: Representative electron micrographs of transverse sciatic nerve sections distal to injury with pseudocoloring of intact (turquoise) and degenerated (magenta) myelinated fibers show more advanced AxD after rapamycin treatment. Scale bar: 2μm. Right: Representative confocal micrographs of whole-mounted distal sciatic nerve stumps from vehicle or rapamycin-treated Thy1.2-YFP-H mice show more advanced axon fragmentation after rapamycin treatment. Scale bar: 100μm. d, f, g, i, Quantitative analysis of relative axon survival in distal sciatic nerve stumps 36h after axotomy in vehicle and rapamycin-treated mice, and mice with the indicated genotypes (Error bars represent s.e.m. d (left), n=3 mice per condition, d (right), n=5 mice for mTORfl/fl and n=7 mice for mTORfl/fl; iSox10Cre, f (left), n=4 mice for Raptorfl/fl and n=5 mice for Raptorfl/fl; P0Cre, f (middle and right), n=7 mice for each genotype, g (left), n=5 mice for c-Mycfl/fl and n=6 mice for c-Mycfl/fl; iSox10Cre, g (middle), n=7 mice for Hif1αfl/fl and n=6 mice for Hif1αfl/fl; P0Cre, g (right), n=6 mice for each genotype, i, n=5 mice for Hif1αfl/fl; c-Mycfl/fl and n=9 mice for Hif1αfl/fl; c-Mycfl/fl; iSox10Cre). e, h, Representative semithin (h only, top) and electron micrographs of transverse sciatic nerve sections from distal nerve stumps of mice with the indicated genotypes 36h after sciatic nerve transection with pseudocoloring of intact (turquoise) and degenerated (magenta) myelinated fibers. Scale bars: 10μm.
Statistical evaluation in d, f, g, and i was performed using Student’s t-test, unpaired, two-tailed.